



TL;DR: Google PageSpeed Insights (PSI) analyzes website speed and Core Web Vitals using real user data (CrUX) and Lighthouse audits. PSI directly impacts SEO rankings and user experience. This guide explains PSI metrics, why they matter, and how to fix common performance issues to improve rankings, UX, and conversions.
Google PageSpeed Insights shows whether your website truly performs or simply looks good. No matter how strong your design or content is, a slow site loses rankings, users, and conversions.
In today’s mobile-first world, slow-loading pages frustrate users, increase abandonment, and make it harder to deliver a good page experience. While website speed is only one of many ranking signals, improving performance helps strengthen Core Web Vitals, user engagement, and overall SEO.
Google PageSpeed Insights goes beyond basic speed testing. Using real user data and Lighthouse audits, it highlights performance issues and provides clear recommendations to improve load time, Core Web Vitals, and rankings for websites.
This guide helps you understand Google PageSpeed Insights, its key metrics, and how to fix speed issues effectively.
Google PageSpeed Insights: Quick Overview
| Question | Quick Answer |
|---|---|
| What is Google PageSpeed Insights? | A free Google tool that analyzes website performance and Core Web Vitals. |
| Is it free? | Yes |
| Does it affect SEO? | Yes, through Core Web Vitals and page experience signals. |
| Does it use real user data? | Yes, via Chrome UX Report (CrUX). |
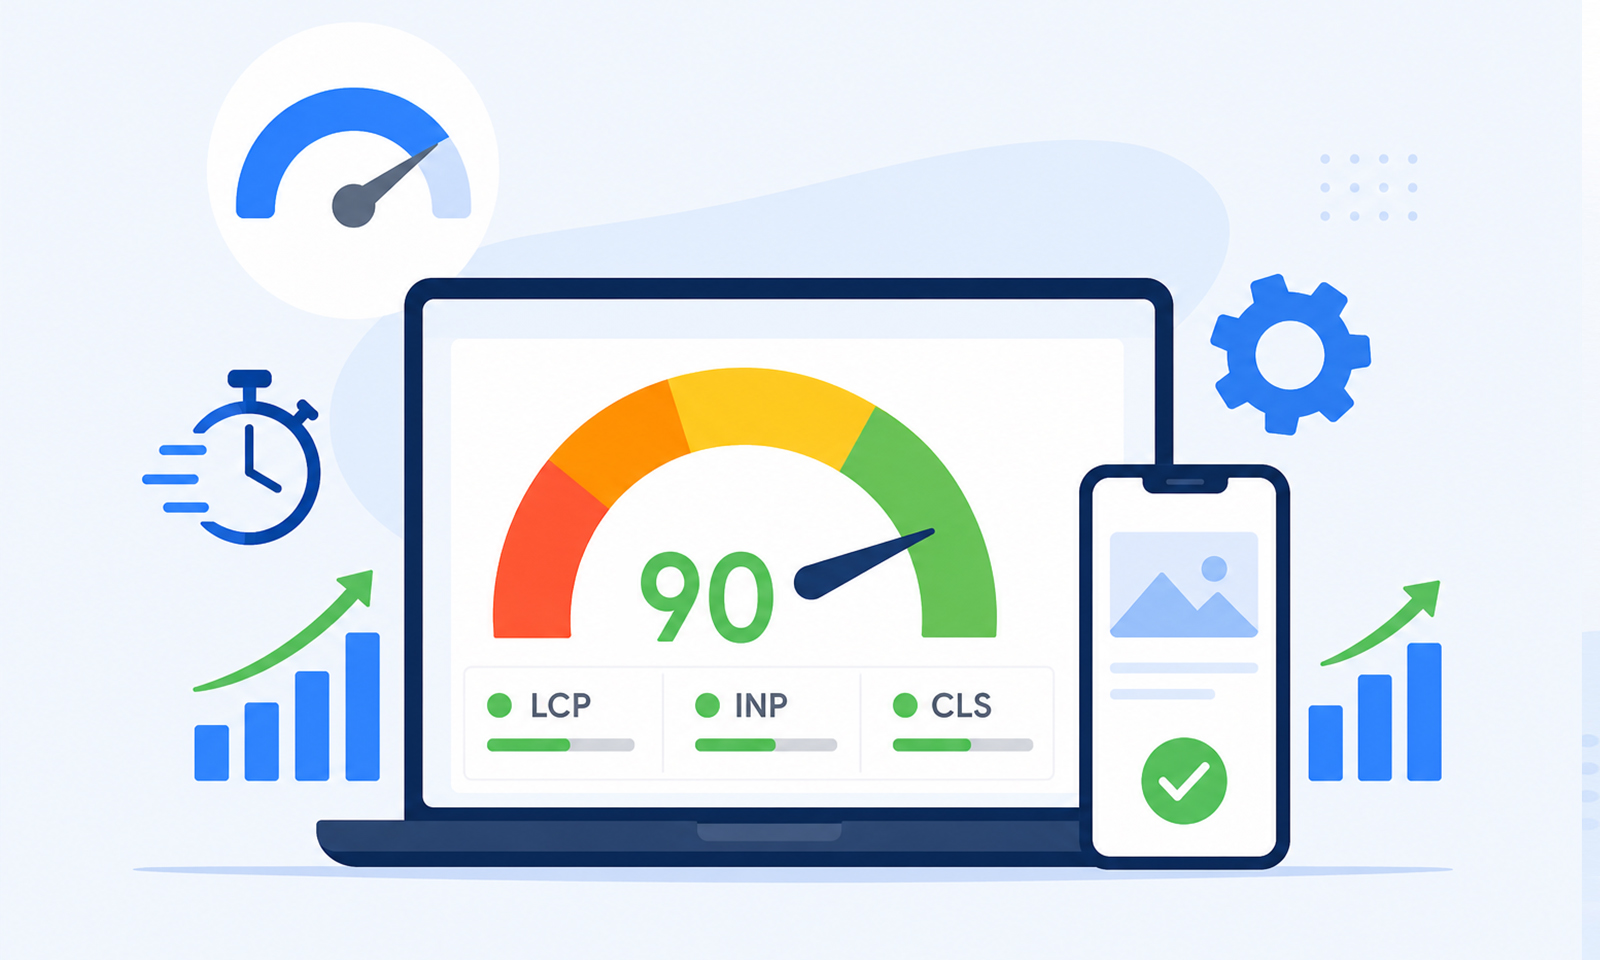
| What score is good? | 90+ is considered good, but passing Core Web Vitals matters more. |
| Mobile or Desktop? | Prioritize Mobile. |
| Best use | Finding and fixing website performance issues. |
What is Google PageSpeed Insights?
Google PageSpeed Insights (PSI) is a free performance analysis tool by Google that measures how fast and stable your web pages load on mobile and desktop devices. It evaluates real user experience data from Chrome users and combines it with Lighthouse-based lab testing to deliver actionable website speed optimization recommendations.
Unlike basic speed testing tools, PSI provides:
- Performance scores
- Core Web Vitals evaluation
- Real user data (field data)
- Lab-based diagnostics
- Actionable optimization recommendations
PSI combines:
- Chrome User Experience Report (CrUX) → real users
- Lighthouse audits → simulated testing
This dual data model makes PSI one of the most reliable website performance tools for SEO and UX optimization.
PageSpeed Insights analyzes each URL separately for both mobile and desktop, helping you identify performance issues specific to each device.
PageSpeed Insights vs Other Website Speed Testing Tools
Before analyzing your website, it’s helpful to understand how Google PageSpeed Insights compares with other popular performance testing tools.
| Feature | Google PageSpeed Insights | Lighthouse | GTmetrix |
|---|---|---|---|
| Real user (CrUX) data | ✅ | ❌ | ❌ |
| Lighthouse lab audit | ✅ | ✅ | ✅ |
| Core Web Vitals | ✅ | Partial | Partial |
| Performance score | ✅ | ✅ | ✅ |
| SEO recommendations | ✅ | Limited | Limited |
| Mobile-first testing | ✅ | ✅ | Optional |
| Best for | SEO & UX optimization | Local performance debugging | Waterfall and loading analysis |
Unlike most website speed testing tools, Google PageSpeed Insights combines simulated Lighthouse audits with real-user Chrome UX Report (CrUX) data whenever enough traffic is available. This gives you a more complete picture of both technical performance and real-world user experience.
This combination helps you understand both how your website performs under test conditions and how actual users experience it, making PSI one of the most reliable tools for improving Core Web Vitals and SEO.
Why Does Page Speed Matter for SEO and Core Web Vitals?
You can have flawless design and high-quality content, but if your website loads slowly, users won’t stay long enough to see it. Page speed is no longer optional; it’s a core ranking signal, conversion driver, and user experience requirement. These statements explain the importance of website speed nowadays:
- Multiple industry studies have shown that slower pages are associated with lower conversion rates, although the exact impact varies by industry, device, and audience.
- Over 60% of global traffic now comes from mobile devices
- Large eCommerce companies like Amazon have consistently reported revenue losses from even small performance delays.
- Users expect pages to load in under 2–3 seconds
Slow page speed can hurt different aspects, such as:
1. SEO Rankings
Page speed contributes to SEO through better page experience and Core Web Vitals, but it is only one part of Google’s ranking systems. Google considers page experience, including Core Web Vitals, as one of many ranking signals. While speed alone won’t make low-quality content rank, it can help comparable pages perform better. Thus, you need to provide the relevant information to the user as quickly as possible.
2. User Engagement
A slow-loading website creates a poor first impression and increases the likelihood that visitors will leave before engaging with your content. Faster websites feel more reliable and encourage users to stay longer. First impressions are important for the user, as it becomes a perception that a site that loads faster is professional, reliable, and trustworthy. Thus, to fulfill the user expectation, site speed is a vital factor.
3. Conversion Rate
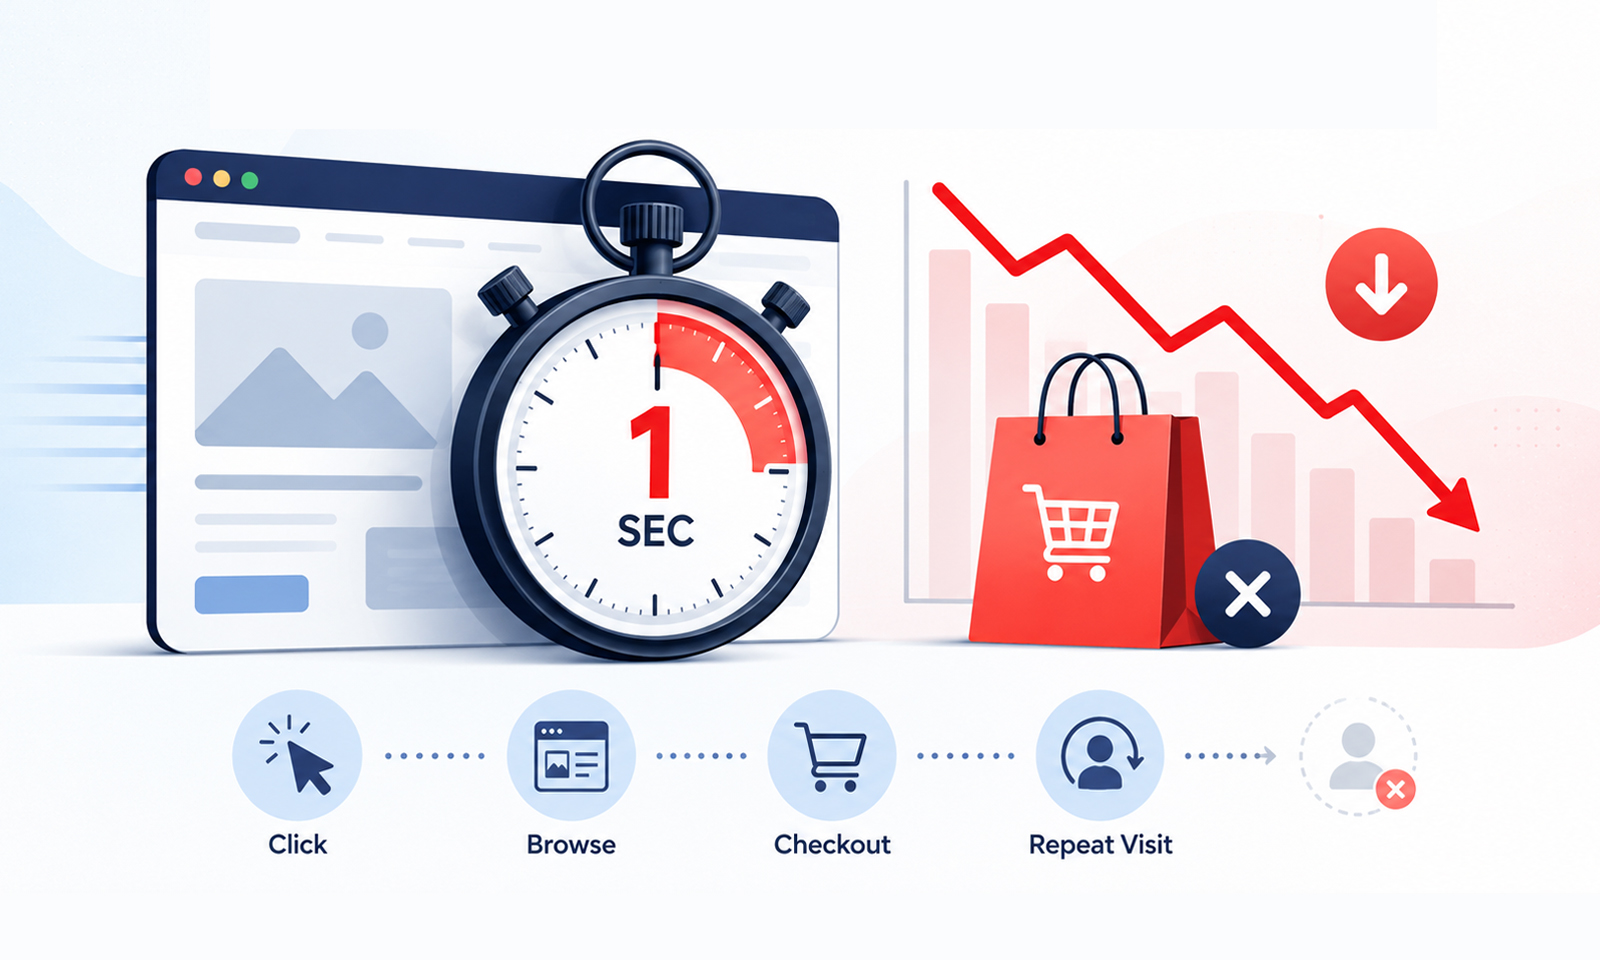
Every second of delay increases the likelihood that users will abandon your website before completing a purchase or enquiry. Delays during key actions such as browsing or checkout can reduce conversions and discourage repeat visits. Seconds of delay can result in the loss of valuable customers, which will directly affect your conversion rate.
4. Mobile Experience
Mobile users’ expectations for site speed are higher than those of desktop users. Mobile users are more likely to leave a site if it takes more than 3 seconds. Fast loading time makes the mobile users’ experience smooth and enjoyable, increasing traffic and conversions.
How to Use Google PageSpeed Insights For Your Website?
Google PageSpeed Insights is simple to use, but understanding each step helps you read the report correctly and take the right actions. Follow these steps to use Google PageSpeed Insight and analyze your website performance accurately.
Step 1: First, go to the Google PageSpeed Insights website on the search engine or simply click the URL https://pagespeed.web.dev/.

Step 2: Enter your page’s or website’s URL that you want to test in the search bar and hit “Analyze.”
You can analyze your homepage, blog posts, landing pages, product pages, or any publicly accessible URL individually, since PageSpeed Insights evaluates one page at a time rather than your entire website.
PSI will generate a detailed report, showing:
- Performance score for both mobile and desktop.
- Core Web Vitals metrics analytics.
- Areas of opportunity and strategies for optimization.
- The Lighthouse performance report with actionable recommendations.

Pro tip: Always focus on mobile speed score first. Google uses mobile-first indexing, so your mobile performance heavily influences your ranking.
Google PageSpeed Insights Report Explained
The PSI report has different sections, which are as follows:
1. Performance Score
This section gives you the overall performance and speed score of your website. The performance on mobile devices and desktops is different due to device limitations. Thus, this report separately shows performance scores for mobile and desktop. You can switch between mobile and desktop scores as shown below:

2. Field Data
This section contains real-world user data that is taken from the Chrome UX report. This measures the actual user experience of your site, which is useful for understanding the real-world performance. If enough real-user data isn’t available, this section may display “Not enough data” instead of Core Web Vitals results.
For example, if you open your site on your browser, it may load quickly as your browser has stored the cached version of your site content. While on the user’s browser, the site is opening for the first time, showing the genuine user experience.
3. Lab Data
This is the simulated analysis from Lighthouse, which includes metrics of:
- Speed Index
- First Contentful Paint
- Time to Interactive
- Total Blocking Time
4. Opportunities
This is the golden section for you, as it provides the suggestions and areas of opportunity in your website. PSI gives suggestions like image optimization for increased speed and eliminating render-blocking resources. Each recommendation comes with the estimated loading time saved in each action.
5. Diagnostics
This section will provide deep insights into scripts, CSS, and other technical areas, which you can fix for deeper optimization. Basically, it’s the diagnostic center of your website, which you can consider when you are done with first aid (basic optimization methods like image optimization).
6. Passed Audits
In this section, you can review the areas in which your website is performing well.
How Google Calculates the PageSpeed Insights Performance Score
Google PageSpeed Insights uses Lighthouse to calculate your website’s Performance Score. According to Google’s Lighthouse Performance Scoring documentation, the score isn’t calculated by simply averaging all metrics. Instead, Lighthouse assigns different weights to each metric based on its impact on the overall user experience.
| Metric | Weight |
|---|---|
| Largest Contentful Paint (LCP) | 25% |
| Total Blocking Time (TBT) | 30% |
| Interaction to Next Paint (INP)* | 15% |
| Speed Index | 15% |
| First Contentful Paint (FCP) | 10% |
| Cumulative Layout Shift (CLS) | 5% |
Note: According to the Lighthouse documentation, Total Blocking Time (TBT) is used as a laboratory metric to evaluate responsiveness, while Interaction to Next Paint (INP) is measured using real-user data as part of Core Web Vitals.
Google PageSpeed Insights Performance Metrics Explained

PSI measures the score based on the following Core Web Vitals metrics:
Interaction to Next Paint (INP)
INP measures how quickly a page responds to user interactions like clicks or taps. It reflects real-world responsiveness and plays an important role in improving your Google PageSpeed Insights performance score.
Good INP Score: ≤ 200 ms
Affected by: JavaScript execution, main-thread blocking
First Contentful Paint (FCP)
It measures the speed and time it takes to load the first piece of content. It plays an important role in improving your Google PageSpeed Insight performance score.
Good score: ≤ 1.8 seconds
Affected by: server response time, render-blocking CSS/JS, font loading, image optimization
Speed Index
Speed is another primary factor on which website performance is measured. It justifies the responsiveness of the website.
Good score: ≤ 3.4 seconds
Affected by: image size, above-the-fold content, JavaScript execution, critical rendering path
Total Blocking Time (TBT)
Total Blocking Time (TBT) measures how long the browser’s main thread remains blocked, preventing users from interacting with the page.
Good score: ≤ 200 ms
Affected by: heavy JavaScript, third-party scripts, unused code, long tasks (>50 ms)
Largest Contentful Paint (LCP)
LCP measures the time it takes for the largest above-the-fold content to load. Above the fold content is what you see first on a website without scrolling.
Good LCP score: ≤ 2.5 seconds
Affected by: images, hero banners, fonts, server speed
Cumulative Layout Shift (CLS)
It measures the unexpected layout shifts that occur in a site while it is loading. It measures the visual stability of a website.
Good LCP score: ≤ 0.1 seconds
Affected by: Images, ads, fonts, and dynamic content.
Field Data vs Lab Data: What’s the Difference?
One of the most confusing parts of Google PageSpeed Insights is the difference between Field Data and Lab Data.
Field Data comes from real Chrome users who have visited your website over the last 28 days. It reflects actual browsing conditions and determines whether your site passes Core Web Vitals.
Lab Data is generated by Lighthouse during a simulated test. It helps identify performance issues that can be reproduced and fixed, even if enough real-user data isn’t available yet.
If the two reports don’t match exactly, that’s normal. Lab Data represents a single controlled test, while Field Data reflects the experience of thousands of real visitors using different devices and network conditions.
How Often Should You Test Google PageSpeed Insights?
It’s a good practice to test your most important pages whenever you make performance-related changes, such as updating your theme, installing new plugins, adding third-party scripts, or redesigning key sections.
Even if your website rarely changes, reviewing your PageSpeed Insights report monthly helps identify new performance issues before they affect user experience or search visibility.
Why Is My Mobile PageSpeed Insights Score Lower Than Desktop?
It’s completely normal for your mobile PageSpeed Insights score to be lower than your desktop score. Mobile devices typically have slower processors, less memory, and slower network connections, making it harder to load and render pages quickly.
Google also evaluates websites using mobile-first indexing, meaning your mobile performance has a greater influence on user experience and search visibility. Rather than trying to achieve identical scores on both devices, focus on passing Core Web Vitals on mobile and improving the experience for real users.
Why Does My PageSpeed Insights Score Change Every Time?
If you’ve tested your website multiple times, you’ve probably noticed that the score isn’t always identical. That’s expected.
Lab tests can vary because of network conditions, server response times, browser activity, and third-party resources loading differently during each test. Field Data also updates over time as Google collects new real-user data.
Instead of focusing on small score fluctuations, monitor long-term trends and prioritize passing Core Web Vitals consistently.
The Business Impact of Google PageSpeed Insights
Even small improvements in Core Web Vitals can result in measurable gains in engagement and conversions, especially on mobile. Google PageSpeed Insights helps businesses identify performance issues that directly affect search rankings, user experience, and revenue. A faster website leads to better visibility, higher engagement, and more conversions.
Key business benefits include:
- Improved SEO visibility: Optimizing the issues highlighted in PageSpeed Insights helps improve Core Web Vitals and overall search performance.
- Better user engagement: Faster pages encourage visitors to stay longer, interact with more content, and reduce bounce rates.
- Higher conversion rates: Improving loading speed creates a smoother user experience that can increase leads and sales.
- Faster mobile experience: Optimizing for mobile devices helps deliver a better experience for the majority of today’s web users.
This makes Google PageSpeed Insights a critical tool for driving measurable business growth through performance optimization.
Most Common Google PageSpeed Insights Issues (and Why They Matter)
Based on recurring website performance audits, these are the optimization issues that appear most frequently in Google PageSpeed Insights reports.
| Issue Found in PSI | How Often We See It | Typical Impact |
|---|---|---|
| Render-blocking CSS & JavaScript | Very Common | Slower FCP and LCP |
| Oversized hero images | Extremely Common | Poor LCP |
| Third-party scripts | Common | High TBT and INP |
| Unoptimized fonts | Common | Slower FCP and CLS |
| Missing browser caching | Common | Slower repeat visits |
| Unused JavaScript | Common | High TBT |
| Large page weight | Common | Slower overall loading |
While every website is different, these are the issues we encounter most frequently during website performance audits. In many cases, resolving just a few of these high-impact problems can significantly improve Core Web Vitals, user experience, and PageSpeed Insights scores without requiring a complete website rebuild.
How to Fix Common Issues in Google PageSpeed Insights
One of the biggest advantages of Google PageSpeed Insights is that it not only identifies performance issues but also provides actionable recommendations to help you fix them. Start by addressing the recommendations with the highest estimated time savings, as these typically have the greatest impact on your PageSpeed Insights score, Core Web Vitals, and overall user experience.
1. Optimize Images to Improve LCP
Large, unoptimized images are one of the most common causes of poor Largest Contentful Paint (LCP). Optimizing them reduces page weight while maintaining visual quality, helping your pages load faster.
- Use next-generation image formats like WebP or AVIF.
- Compress images without noticeable quality loss.
- Serve responsive images that match different screen sizes and devices.
2. Eliminate Render-Blocking CSS and JavaScript
Render-blocking CSS and JavaScript prevent the browser from displaying visible content until those files are loaded. Reducing these resources helps improve First Contentful Paint (FCP) and Largest Contentful Paint (LCP).
- Combine or defer non-critical CSS and JavaScript files.
- Inline critical CSS needed for above-the-fold content.
- Use the async and defer attributes for JavaScript wherever appropriate.
3. Minimize Server Response Times
A slow server delays every resource requested by the browser, affecting multiple PageSpeed Insights metrics. Improving server response times creates a faster and more reliable browsing experience.
- Choose a fast and reliable hosting provider.
- Enable browser and server-side caching.
- Use a Content Delivery Network (CDN) to deliver assets from servers closer to your visitors.
- Optimize your database and server configuration.
4. Utilize Browser Caching
Browser caching stores static resources on a visitor’s device, allowing returning users to load pages faster without downloading the same files again.
- Configure appropriate cache headers for images, CSS, JavaScript, fonts, and other static assets.
5. Minify CSS, JavaScript, and HTML
Minifying removes unnecessary characters, comments, and whitespace from your code, reducing file sizes and helping browsers download assets more efficiently.
- Minify CSS, JavaScript, and HTML files before deploying your website.
6. Remove Unused JavaScript
Unused JavaScript increases page size and keeps the browser busy processing code that isn’t required, which can negatively affect responsiveness and Total Blocking Time (TBT).
- Remove unused libraries, plugins, frameworks, and JavaScript files that are no longer needed.
7. Preload Critical Fonts and Hero Images
Preloading tells the browser which resources should be downloaded first, helping above-the-fold content render faster and improving perceived loading speed.
- Preload critical fonts, hero images, and other high-priority resources required during the initial page load.
8. Lazy-Load Images and Videos
Loading every image and video immediately can slow down the initial page load. Lazy loading delays off-screen media until users scroll near it, improving loading performance without affecting the user experience.
- Enable lazy loading for below-the-fold images and videos to reduce the initial page weight.
Why Doesn’t My Website Have Field Data?
Google PageSpeed Insights only displays Field Data when enough real Chrome users have visited your page. New websites, low-traffic pages, or recently published content often don’t have sufficient usage data, so only Lab Data is shown.
This doesn’t mean your website has a problem. Continue improving your Lighthouse metrics, and once enough visitors access your page, Google will begin displaying real-user performance data automatically.
Is Google PageSpeed Insights Good for SEO?
Yes. Page speed and Core Web Vitals are confirmed ranking signals, but they work alongside content relevance, intent, and authority. It is more significant since 2021, as the Core Web Vitals became the official part of the ranking algorithm of Google.
That means poor performance could be holding your site back, even if your content is amazing. I mean, what’s the point of testing users’ patience and making them wait to see your amazing content? So, it’s vital to improve your speed first to provide your intended message to the user.
Common Myths About Google PageSpeed Insights
1. My site must score 100 to rank on Google
False. Speed is a ranking factor, but it’s one of many. Content quality and relevance matter just as much. So, it is good to focus on the betterment of your website rather than chasing the 100 out of 100.
2. Desktop speed score is more important than the mobile speed score
False. Google uses mobile-first indexing to rank websites, so prioritize mobile speed. The mobile user base is drastically increasing, and mobile devices have slower network speeds than desktops, so it’s important to focus on mobile optimization.
3. A single PSI test is enough!
False. Test multiple pages and monitor consistently, as performance can vary by device, network, or location. It is good to test your website after optimization, so you can compare your progress.
4. Google PageSpeed Insights and Lighthouse always produce identical results
False. Although PageSpeed Insights uses Lighthouse for Lab Data, it also displays Field Data from the Chrome User Experience Report (CrUX), which Lighthouse alone does not provide.
What Should You Fix First in Google PageSpeed Insights?
If your PageSpeed Insights report shows dozens of recommendations, don’t try to fix everything at once. Prioritize the issues that have the biggest impact on Core Web Vitals and real user experience. Start in this order:
- Improve Largest Contentful Paint (LCP) by optimizing hero images and server response times.
- Remove render-blocking CSS and JavaScript.
- Reduce heavy third-party scripts.
- Fix layout shifts (CLS).
- Optimize fonts and browser caching.
- Remove unused CSS and JavaScript.
Key Takeaways
Google PageSpeed Insights is one of the most valuable tools, not only for user experience but also for thriving in Google rankings. No matter how excellent you’ve designed your website and how engaging your content is. If the website speed is slow, then you are out of the search engine page results.
Google PageSpeed Insights is your modern solution for diagnosing and even improving your site performance, before they impact rankings, conversions, and user experience. Use it regularly to monitor Core Web Vitals, identify optimization opportunities, and measure improvements over time.
A perfect PageSpeed Insights score isn’t the goal. The real objective is building a fast, stable website that passes Core Web Vitals, provides an excellent user experience, and supports better search visibility. Use PageSpeed Insights as an ongoing optimization tool, not a one-time test to continuously improve your site’s performance.
FAQs
Q1. What does the Google PageSpeed Insights tool do?
Google PageSpeed Insights looks at how well your website works on both mobile and desktop. It gives you scores and suggestions for how to speed up loading times, enhance Core Web Vitals, and make the overall user experience better.
Q2. Is PageSpeed Insights beneficial for people who are new to it?
Yes, PageSpeed Insights is easy to use for beginners because it provides you with a straightforward score from 0 to 100 and shows you clear fixes with color-coded suggestions (red, orange, green). Beginners can find places that need to be optimized even if they don't know much about technology.
Q3. Is it free to use PageSpeed Insights?
Yes, there is no cost to use Google PageSpeed Insights. Anyone can type in a website URL and obtain extensive information about how it works and how to make it better right away.
Q4. What metrics does PageSpeed Insights measure?
It measures Core Web Vitals (Largest Contentful Paint, First Input Delay/Interaction to Next Paint, and Cumulative Layout Shift) as well as other metrics, including Total Blocking Time, Speed Index, and First Contentful Paint.
Q5. Why is Google PageSpeed Insights significant for search engine optimization?
In Google Search, the speed of a website and its Core Web Vitals are two of the things that affect its ranking. A higher PageSpeed Insights score makes the user experience better, lowers bounce rates, and can help your search engine rankings.
Q6. How high should a PageSpeed Insights score be to be good?
A score of 90 or higher is great, 50–89 is average and requires work, and anything below 50 means bad performance that could impact SEO and conversions.
About the Author