






TL;DR: Mobile PageSpeed scores are often lower than desktop scores because mobile tests simulate different device and network conditions. Compare the same URL on both devices, check LCP, INP, and CLS against Google’s recommended thresholds, and use Lighthouse diagnostics to identify issues. Validate improvements with real-user field data when available.
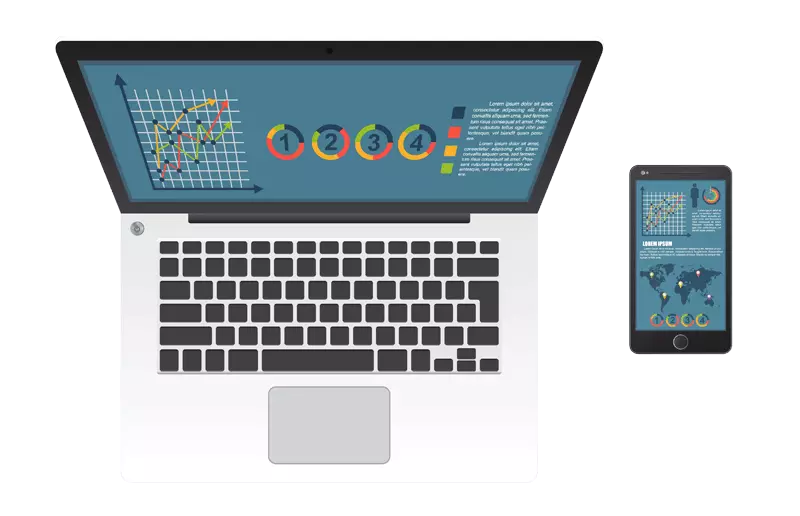
Mobile and desktop PageSpeed scores can differ because the tests use different device and network conditions. A webpage may perform well in a desktop test but receive a lower mobile score because mobile testing typically simulates a less powerful device and a slower connection.
Google PageSpeed Insights provides a performance score, diagnostic information, and real-user field data when available. These help you understand different aspects of website performance, but the score itself is not the same as actual loading time or a Core Web Vitals assessment.
In this guide, you’ll learn why mobile and desktop scores differ, how to compare their results, which Core Web Vitals benchmarks to check, and how to identify the performance issues that need attention first.
How Mobile and Desktop PageSpeed Scores Differ
Mobile and desktop PageSpeed scores can differ because Google PageSpeed Insights tests pages under different device and network conditions. Mobile tests typically simulate a less powerful device and a slower connection, while desktop tests use desktop-oriented conditions.
| Comparison factor | Mobile PageSpeed test | Desktop PageSpeed test |
|---|---|---|
| Test conditions | Simulated mobile device and network | Simulated desktop device and network |
| JavaScript execution | Can take longer on less powerful simulated hardware | May complete faster under desktop test conditions |
| Resource loading | Network conditions can increase download delays | Test conditions may allow resources to download faster |
| Common issues to investigate | Large images, render-blocking resources, JavaScript execution, server response time | Large assets, JavaScript execution, caching, render-blocking resources |
| Real-user validation | Review mobile field data when available | Review desktop field data when available |
These are typical differences, not guaranteed outcomes. The results depend on the webpage, its resources, the test configuration, and the conditions experienced by visitors.
What Does a PageSpeed Score Actually Measure?
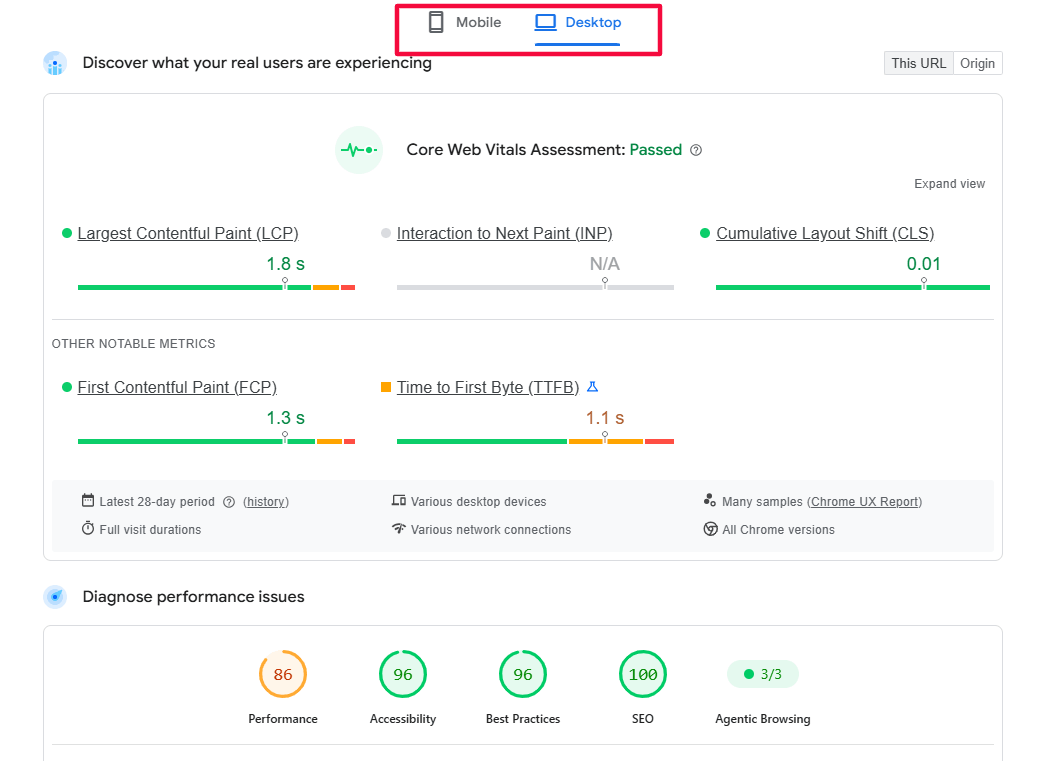
Google PageSpeed Insights provides a performance score from 0 to 100 based on Lighthouse lab testing. It also reports diagnostic information and, when available, real-user field data from the Chrome User Experience Report (CrUX).
The score helps you identify potential performance issues, but it is not a direct measurement of how many seconds a page takes to load. It also isn’t the same as a Core Web Vitals assessment.
Lighthouse evaluates several performance factors, including loading speed, JavaScript execution, and opportunities to improve resource delivery. The final score can change when the page, its resources, or the testing conditions change.
metrics, diagnostic recommendations, and real-user field data when available. The score helps identify potential issues under test conditions, while field data shows how visitors have experienced the page over time. A high lab score does not automatically mean that the page meets all Core Web Vitals thresholds for real users.
Core Web Vitals Benchmarks for Mobile and Desktop
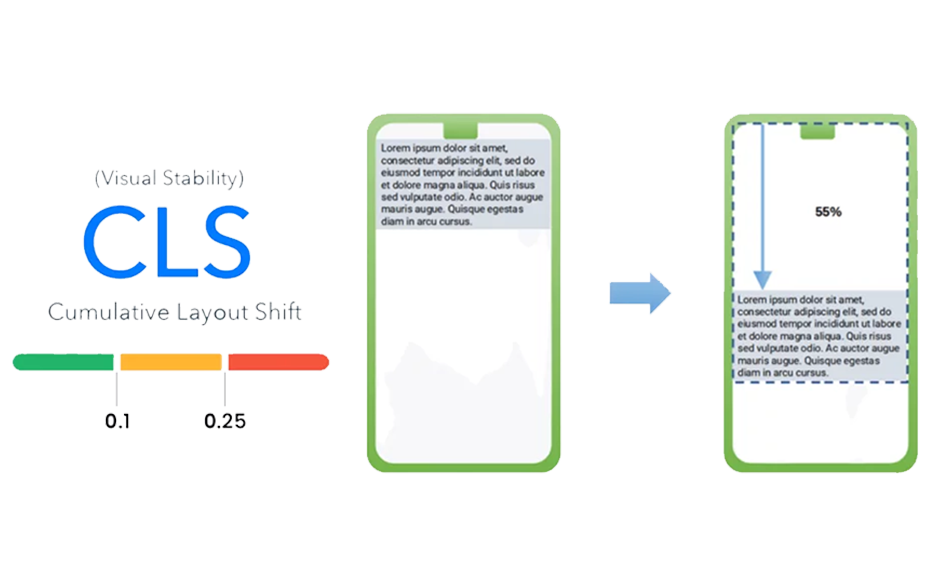
Google’s Core Web Vitals measure three important aspects of user experience: loading performance, responsiveness, and visual stability. The same recommended thresholds apply to mobile and desktop, but the results can differ between device categories.
| Core Web Vital | What it measures | Good result |
|---|---|---|
| Largest Contentful Paint (LCP) | How quickly the main visible content loads | 2.5 seconds or less |
| Interaction to Next Paint (INP) | How quickly a page responds to user interactions | 200 milliseconds or less |
| Cumulative Layout Shift (CLS) | How much unexpected layout movement occurs | 0.1 or less |
These thresholds are assessed at the 75th percentile of real page visits, separately for mobile and desktop. A page meets the recommended target when all three metrics are within their good thresholds at that percentile.
Remember: A high PageSpeed score does not automatically mean that a page passes Core Web Vitals. Check the individual metrics and available field data to understand how visitors experience the page.
Why Do Mobile and Desktop PageSpeed Scores Differ?
A website can use the same code and content on mobile and desktop and still receive different scores. The main reasons usually relate to test conditions, resource delivery, and how much work the browser must perform.
1. Device Processing Power
JavaScript-heavy pages can take longer to process on less powerful devices. If a page runs large scripts, loads several third-party tools, or performs expensive browser tasks, the impact may be more noticeable in a mobile test.
To investigate, review Lighthouse diagnostics for long JavaScript tasks and excessive script execution. Remove unnecessary scripts where possible and defer non-critical work when appropriate.
2. Network Conditions and Server Response Time
The time required to download a page depends on network conditions, resource sizes, caching, and the server’s response. A mobile test may simulate slower network conditions than a desktop test, making large files and delayed responses more noticeable.
Check Time to First Byte (TTFB) to investigate how quickly the server begins responding. Also review whether large resources, redirects, or render-blocking files delay the page’s initial display.
3. Images and Other Large Resources
Large images, videos, fonts, and scripts can delay loading. Their impact depends on the file size, when each resource is requested, and whether it is needed for the initial view.
Review the following:
- Serve images at dimensions appropriate for their display size.
- Compress images to reduce file sizes while maintaining acceptable visual quality.
- Use responsive image delivery where appropriate.
- Avoid lazy-loading the main above-the-fold image if it delays LCP.
- Reduce unnecessary JavaScript and CSS.
- Load non-critical resources in a way that does not delay important content.
4. Render-Blocking CSS and JavaScript
Browsers may need to process certain stylesheets and scripts before displaying content or responding smoothly to interactions. Unnecessary render-blocking resources can therefore affect mobile and desktop results.
Use PageSpeed Insights to identify relevant diagnostics before changing how resources load. Depending on the issue, useful changes may include removing unused CSS, deferring non-critical JavaScript, or prioritizing resources needed to render the main content.
5. Caching and Resource Delivery
Caching can reduce the need to download the same resources repeatedly. A content delivery network (CDN) can also help serve supported resources from locations closer to visitors.
However, caching and CDN configuration do not guarantee a higher score. Their impact depends on the website’s hosting setup, resource types, cache rules, and visitors’ locations.
How to Compare Mobile and Desktop Scores in PageSpeed Insights
Use the same URL when comparing mobile and desktop performance. Testing different pages can produce misleading conclusions because their content, images, scripts, and layout may differ.
Follow these steps:
- Open Google PageSpeed Insights.
- Enter the URL of the page you want to test.
- Review the mobile report and record the Lighthouse performance score, lab metrics, diagnostics, and any available field data.
- Switch to the desktop report and record the corresponding results, keeping lab metrics separate from real-user field data.
- Compare the results to identify which issues appear in one test, both tests, or neither.
- Repeat the tests under comparable conditions before drawing conclusions about small score changes.
Keep a simple record of the URL, test date, device category, score, LCP, CLS, and relevant diagnostics. Include INP when field data is available. In lab testing, use Total Blocking Time (TBT) to investigate potential responsiveness problems because Lighthouse cannot measure INP without real user interactions.
Do not assume that a score difference identifies the cause by itself. Use the diagnostic details to determine what needs investigation.
For a real-world example, Rick Mantheiy shared on Trustpilot that his large-catalog website had loading times of 1.57 seconds on desktop and 2.42 seconds on mobile after using Website Speedy. These are customer-reported figures, not independently verified PageSpeed scores or Core Web Vitals results. The example highlights why it’s useful to assess website performance across devices rather than relying on a desktop test alone.
How to Improve a Low Mobile PageSpeed Score Without Hurting Desktop Performance
If a page scores well on desktop but poorly on mobile, start by identifying the issues that affect the mobile report. Avoid applying every recommended optimization without checking whether it addresses the problem.
Step 1: Identify the Largest Loading Delays
Review LCP, TTFB, and the resource-loading diagnostics. Determine whether the main content is delayed by a slow server response, an oversized image, render-blocking resources, or another issue.
Step 2: Reduce Unnecessary Resource Downloads
Check whether images, stylesheets, JavaScript files, fonts, and third-party resources are larger or more numerous than necessary. Minification can reduce code file sizes, but it does not automatically reduce the number of HTTP requests.
Prioritize changes that address the issues identified in the test.
Step 3: Improve JavaScript Execution
Review long tasks and unnecessary scripts that keep the browser’s main thread busy. Remove scripts that are no longer needed and defer non-critical work where appropriate. Test interactive features after making changes to ensure they still work correctly.
Step 4: Review Image Delivery
Check the dimensions, file sizes, formats, and loading priority of images. Make sure important above-the-fold content is discovered promptly, while images further down the page can be loaded when appropriate.
Step 5: Retest Mobile and Desktop
Run both tests again after each meaningful change. A change that improves mobile performance may also help desktop, but its effect depends on the page and the issue being addressed. Check for regressions rather than assuming every optimization benefits both devices equally.
Website Speedy can automate supported website performance optimizations, depending on the platform and configuration. You should still test your pages and verify that the changes address the specific issues identified in your reports.
Lab Data vs. Real-User Data: What’s the Difference?
Lab data and field data answer different questions, so use both when evaluating mobile and desktop performance.
Lab data comes from controlled tests, such as Lighthouse. It helps identify potential problems under specific testing conditions and is useful when comparing changes before and after an optimization.
Field data comes from real visits and reflects the devices, networks, locations, and interactions of actual users. PageSpeed Insights may display CrUX field data when sufficient data is available for the page or its origin.
The two types of data may not agree. A lab test may show a good score while field data reveals that some visitors experience slow loading or delayed interactions. Differences can arise from device capabilities, network conditions, user behavior, and how the page changes after its initial load.
Use Chrome User Experience Report documentation to learn more about real-user performance data. For broader monitoring, review the Core Web Vitals report in Google Search Console.
After making changes, repeat your lab tests under comparable conditions. Then review field data when enough new visits have been collected. Field data may take time to reflect recent changes.
Best Tools to Compare Mobile and Desktop Performance
Different tools serve different purposes. Use the one that matches the question you need to answer.
- Google PageSpeed Insights: Compare mobile and desktop performance scores, review Lighthouse diagnostics, and check available field data.
- Chrome DevTools: Investigate browser activity, JavaScript execution, rendering, and performance issues in more detail.
- WebPageTest: Run configurable tests and examine how page resources load under selected device and network conditions.
- Google Search Console: Monitor reported Core Web Vitals issues across groups of pages when field data is available.
- GTmetrix: Review performance reports and resource-loading diagnostics using the test options available in the service.
A single tool cannot explain every performance issue. Start with PageSpeed Insights for the mobile-versus-desktop comparison, then use more detailed diagnostics when you need to investigate a specific cause.
Key Takeaway
Mobile and desktop PageSpeed scores can differ because the tests use different device and network conditions and because pages place different demands on the browser. Compare the same URL on both devices, review the Core Web Vitals benchmarks, and use diagnostic information to identify the cause of a low score.
Use lab tests to investigate issues and field data to understand how real visitors experience your website. Make targeted changes, then test again to verify their impact rather than relying on a single score.
Frequently Asked Questions
Why is my mobile PageSpeed score lower than my desktop score?
Mobile tests typically simulate a less powerful device and slower network conditions than desktop tests. JavaScript execution, large images, render-blocking resources, and server delays can therefore have a greater impact on the mobile result. Review the diagnostics for the specific page to identify the cause.
Does a high PageSpeed score guarantee good Core Web Vitals?
No. PageSpeed Insights reports a Lighthouse performance score and may also provide real-user field data. Core Web Vitals use separate metrics for loading performance, responsiveness, and visual stability. Review the individual metrics and available field data instead of relying on the score alone.
Does improving PageSpeed scores improve Google rankings?
Not necessarily. Website performance contributes to user experience, and Core Web Vitals are part of Google's page experience considerations. However, a higher PageSpeed score does not guarantee better rankings. Google uses multiple signals, including relevance and content quality.
About the Author