


TL;DR: Lighthouse and PageSpeed Insights are not the same tool, even though PSI runs on Lighthouse under the hood. Lighthouse gives you controlled lab data, great for diagnosing issues. PageSpeed Insights layers CrUX field data on top, which is what Google actually uses for rankings. To truly improve website speed, you need both, used together strategically.
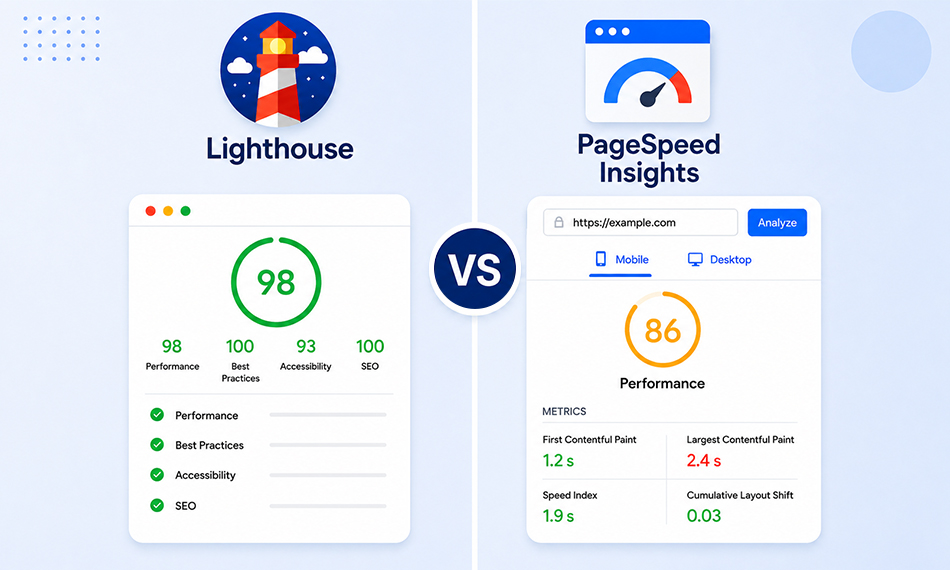
You run Lighthouse in Chrome DevTools and get a Performance score of 87. You then paste the same URL into PageSpeed Insights and see a 64. You scratch your head, wondering which number to trust and which one actually helps you improve website speed?
This is one of the most common points of confusion in web performance, and it happens to developers, SEOs, and site owners every single day. The Lighthouse vs PageSpeed Insights debate isn’t about one tool being “better”. It’s about understanding what each tool is actually measuring, why those measurements legitimately differ, and which one should guide your next optimization move.
What Is Google Lighthouse?
Lighthouse is an open-source, automated auditing tool built by Google. You can run it directly inside Chrome DevTools, via the command line (Lighthouse CLI), or as part of a CI/CD pipeline. It generates a lab-based performance score by simulating how a page loads in a controlled environment, fixed device emulation, fixed network throttling, and a specific Chrome version.
The Lighthouse performance score isn’t just about raw speed. It’s a weighted composite of metrics tied to loading performance, responsiveness, and visual stability:
- First Contentful Paint (FCP) – 10%
- Speed Index – 10%
- Largest Contentful Paint (LCP) – 25%
- Total Blocking Time (TBT) – 30%
- Cumulative Layout Shift (CLS) – 25%
While Lighthouse still uses Total Blocking Time (TBT) in its scoring model, Google’s real-world Core Web Vitals now evaluate responsiveness using Interaction to Next Paint (INP), which replaced First Input Delay (FID) in March 2024.
What Is Google PageSpeed Insights?
PageSpeed Insights (PSI) is a free web-based tool available at pagespeed.web.dev. On the surface, it also runs Lighthouse and produces a similar 0–100 performance score. But that’s only half the story.
What makes PageSpeed Insights fundamentally different is that it combines Lighthouse lab data with field data from the Chrome User Experience Report (CrUX). CrUX collects anonymized performance metrics from real Chrome users over a rolling 28-day window and reports at the 75th percentile, meaning the score reflects what 75% of your actual visitors experience.
This means when you use PageSpeed Insights, you’re looking at two distinct layers of information simultaneously:
- Field data (top section): Real user measurements via CrUX, LCP, INP, CLS scores from actual visits.
- Lab data (bottom section): A fresh Lighthouse test run from one of Google’s server locations.
Understanding this split is the foundation of the entire Lighthouse vs PageSpeed Insights discussion.
Lighthouse vs PageSpeed Insights: Lab Data vs Field Data
This is the distinction that most people miss, and it’s arguably the most important thing to understand in web performance.
Lab data (what Lighthouse produces) tests your page under one specific, simulated set of conditions: one device, one network speed, one location. It’s synthetic and entirely controlled. This is excellent for debugging, you can isolate a problem, fix it, rerun the test, and see an immediate difference.
Field data (what CrUX provides in PSI) aggregates real-world data from thousands or millions of actual user sessions on your site. It captures the diversity of your real audience: people on 3G in rural areas, people on fast fiber connections in cities, people on five-year-old Android phones, people on the latest MacBook Pro.
The 75th percentile threshold means Google is looking at the experience of users who are closer to the bottom quarter in terms of performance conditions.
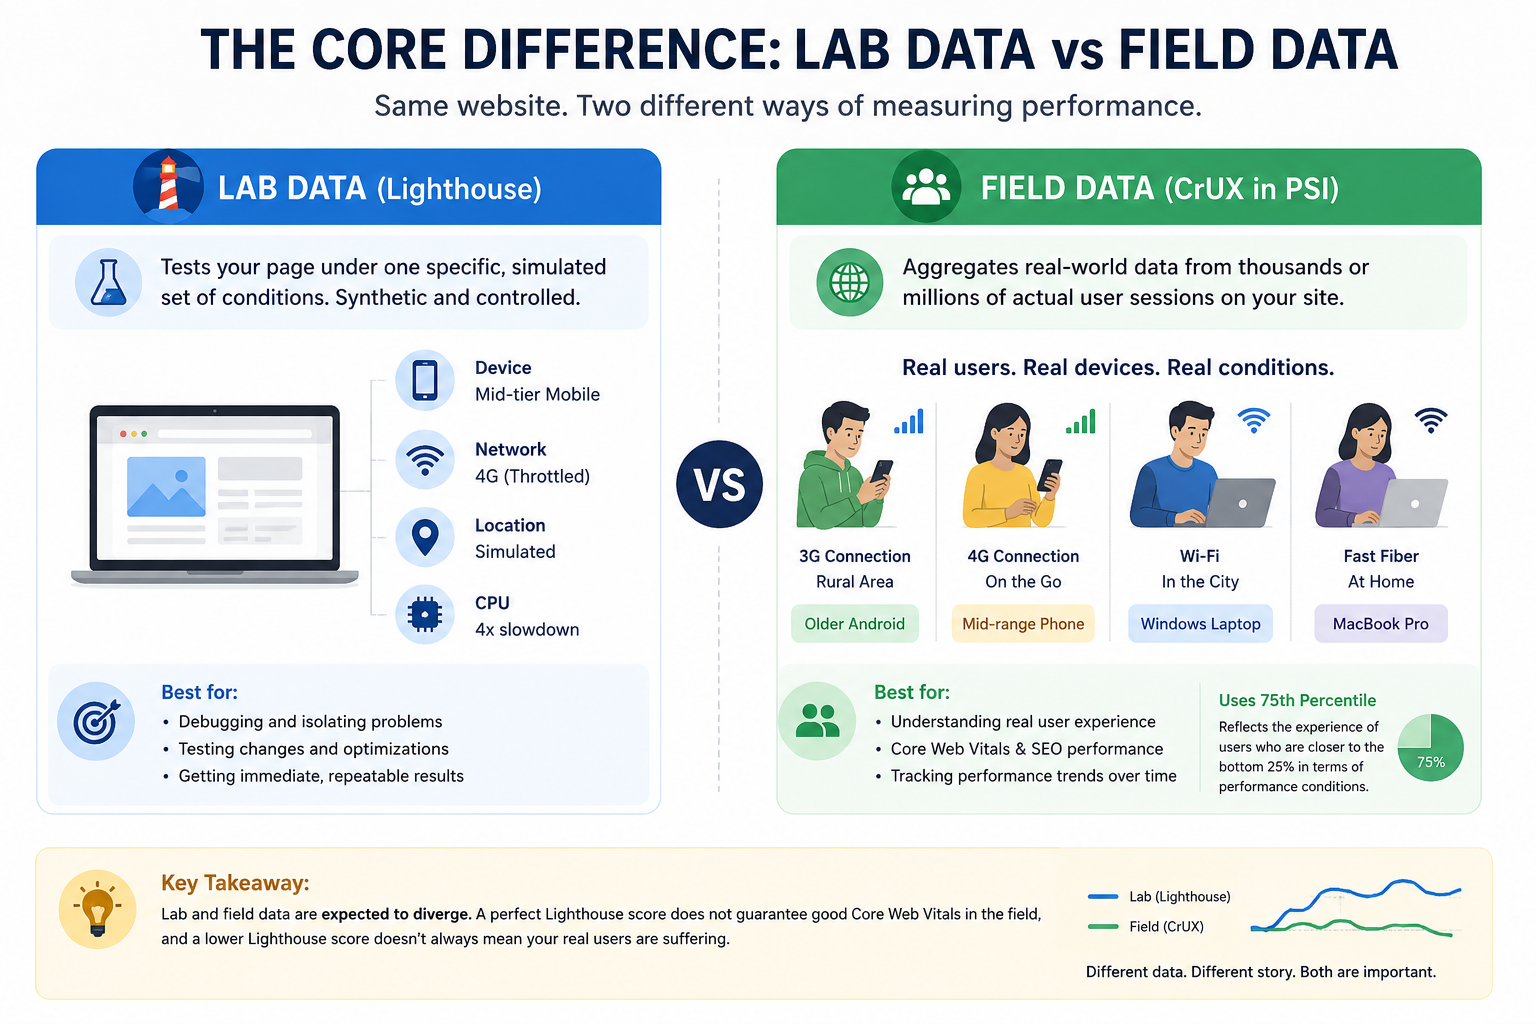
As the Chrome Web Vitals team at Google has documented, lab and field data are expected to diverge. A perfectly optimized Lighthouse score does not guarantee good Core Web Vitals in the field, and conversely, a lower-than-expected Lighthouse score doesn’t always mean your real users are suffering.
A Quick Comparison: Lighthouse vs PageSpeed Insights
Lighthouse and PageSpeed Insights are closely related, but they are not identical tools. While both analyze website performance, they collect and interpret data differently. Lighthouse focuses on controlled lab testing for debugging and optimization, while PageSpeed Insights combines Lighthouse data with real-world user experience metrics from the Chrome UX Report (CrUX).
Which Is Better: Lighthouse or PageSpeed Insights?
This is the real question, and it depends on what you’re trying to find out, as both tools have a clear role.
If you intend to know how your real users experience your site, PageSpeed Insights wins. Its CrUX field data aggregates actual visitor sessions across real devices, networks, and geographies over a rolling 28-day window. This is the data that powers Google Search Console’s Core Web Vitals report and directly influences your search rankings.
If you’re trying to find a precise, repeatable diagnosis of what’s affecting your performance, Lighthouse wins. It gives you a controlled, consistent measurement every time you run it, along with specific Opportunities and Diagnostics that tell you exactly what to fix. When you make a change, Lighthouse shows the impact immediately.
So, the practical solution is to use PageSpeed Insights field data to understand how your site performs for real users and where you stand with Google. Use Lighthouse to pinpoint and fix the underlying issues. They’re not competitors; they’re two tools solving two different parts of the same problem.
Why Lighthouse and PageSpeed Insights Scores Differ
Even if you only compare the lab data portion of PSI against your local Lighthouse run, you’ll still see a gap. Here’s why:
1. Different Server Locations
PageSpeed Insights runs Lighthouse from Google data centers in Oregon, South Carolina, the Netherlands, or Taiwan. The specific server that handles your test depends on your IP address routing, not your server location.
If your site doesn’t have a CDN and PSI routes a test from Taiwan to a US-only origin server, your Time to First Byte (TTFB) will be artificially inflated, pushing your LCP score lower. A 10–15 point gap between PSI and local Lighthouse is considered completely normal for this reason alone.
When you run Lighthouse locally in DevTools, you’re connecting from your own machine, likely geographically close to your server or via a cached CDN node.
2. Different Hardware (CPU Speed)
Lighthouse simulates a mid-tier mobile device by applying a CPU throttling multiplier. PSI runs on Google’s server hardware with a specific throttling profile. Your local machine is likely faster, which means your local Lighthouse scores will almost always be more optimistic than PSI’s.
3. Simulated vs. Applied Network Throttling
This is a subtle but critical technical difference. By default, Lighthouse uses simulated throttling; it loads the page at full speed, then mathematically models how long it would have taken on a slower connection. PageSpeed Insights also uses simulated throttling.
The problem with simulated throttling is that the simulation can sometimes produce metrics that are faster than the unthrottled page load itself, which makes no logical sense. This is a documented limitation. More advanced tools like WebPageTest use packet-level throttling, which actually slows the network at the OS level, producing more physically accurate results.
4. Chrome Extensions
When you run Lighthouse locally, any Chrome extensions you have installed (ad blockers, translation tools, password managers) can inject scripts or block requests, skewing your results, sometimes significantly. PSI runs in a clean, extension-free environment. Always use Incognito mode or a fresh Chrome profile for local Lighthouse testing.
5. Chrome and Lighthouse Version Differences
Google updates the Lighthouse scoring algorithm periodically. If your DevTools version is slightly behind PSI, you may be comparing scores from two different scoring models. Always check which Lighthouse version was used when comparing results across tools.
Which Data Type Matters More for SEO?
This is the question most site owners actually care about. The answer is unambiguous: Google uses CrUX field data, not Lighthouse lab scores, as the ranking signal for Core Web Vitals.
Google confirmed this explicitly in its Search documentation. The Core Web Vitals report in Google Search Console is powered by CrUX, not Lighthouse. A page that achieves a Lighthouse performance score of 90 can still fail Core Web Vitals in Search Console if the real-user field data tells a different story.
As the 2025 Web Almanac data shows, only around 48% of mobile pages and 56% of desktop pages pass all three Core Web Vitals, a stark reminder that lab scores and real-world passing rates don’t always correlate.
The three metrics that form Core Web Vitals, Largest Contentful Paint (LCP), Interaction to Next Paint (INP, which replaced FID in March 2024), and Cumulative Layout Shift (CLS), are assessed entirely from field data. To pass, 75% of your users need to have a “Good” experience across all three.
So yes: for rankings, the field data section in PageSpeed Insights is what you should look at first.
How to Use Lighthouse and PageSpeed Insights Together
Knowing that both tools have distinct purposes, here’s how experienced performance engineers actually use them:
Step 1: Start with PageSpeed Insights field data
Go to pagespeed.web.dev, enter your URL, and check the “Discover what your real users are experiencing” section. If your LCP, INP, or CLS shows “Needs Improvement” or “Poor,” that’s a confirmed SEO and UX problem. This is your priority list.
Step 2: Use Lighthouse (PSI lab data or DevTools) to diagnose
Once you know a metric is failing in the field, scroll down in PSI to the lab data section, or open Chrome DevTools → Lighthouse. The Opportunities and Diagnostics sections will surface specific issues, render-blocking scripts, unoptimized images, excessive JavaScript execution time, missing font-display declarations, and more.
Step 3: Verify with Google Search Console
The Core Web Vitals report in Search Console gives you a site-wide view of field performance across URL groups. This is especially useful for identifying which page templates (product pages, blog posts, landing pages) have systemic issues.
Step 4: Re-measure and track over time
Because CrUX field data has a rolling 28-day window, improvements you make today won’t appear in the field data for several weeks. Use Lighthouse immediately after changes to verify progress in the lab, then wait for CrUX to confirm the real-world impact.
Common Lighthouse and PSI Score Mistakes
One of the biggest mistakes people make with Lighthouse and PageSpeed Insights is treating the final score as the only thing that matters. Both tools are useful, but without understanding how the data is collected and what the metrics actually represent, it’s easy to misinterpret the results and optimize for the wrong things.
1. Chasing a Lighthouse score of 100.
A perfect lab score doesn’t equal passing Core Web Vitals. Focus on the field data green lights, not the lab number.
2. Testing on desktop only.
Google uses mobile-first indexing. Always check PSI scores for mobile, even if your traffic skews desktop. Mobile field data is what matters for the ranking signal.
3. Running one test and accepting the result.
Both Lighthouse and PSI scores can vary between runs; a ±5-point fluctuation is normal due to server variance. Run multiple tests and look at averages.
4. Ignoring the 28-day lag in CrUX data.
If you just deployed a major performance improvement, don’t panic when your PSI field data doesn’t immediately improve. The field data is a historical rolling window, give it at least 28 days to fully reflect your changes.
5. Treating small sites as having no data.
If your site doesn’t have enough Chrome traffic, CrUX may not have data for it. In that case, PSI will only show lab data. This isn’t a sign of failure, it just means you’ll rely entirely on Lighthouse diagnostics until traffic grows.
How to Improve Website Speed Based on These Insights
Once you’ve identified what to fix, here’s where to start:
For LCP (Largest Contentful Paint):
Preload your LCP image resource using . Switch to a CDN if you haven’t already. TTFB is one of the top causes of poor LCP. Compress and serve images in modern formats (WebP, AVIF). Consider server-side rendering or static generation for content-heavy pages.
For INP (Interaction to Next Paint):
Break up long JavaScript tasks into smaller chunks. Avoid heavy initialization scripts that load synchronously. Defer or lazy-load third-party scripts (chat tools, analytics, tag managers) that block the main thread.
For CLS (Cumulative Layout Shift):
Always define explicit width and height attributes on images and videos. Use font-display: optional or swap to prevent invisible text flashes. Avoid injecting content above the fold after the initial render.
Conclusion
The Lighthouse vs. PageSpeed Insights question doesn’t have a single winner because they solve different problems. Lighthouse is ideal for diagnosing and fixing performance issues during development, while PageSpeed Insights helps you understand how real users experience your site through field data and Core Web Vitals.
The best approach is to use both together: Lighthouse for technical debugging and PSI for real-world performance insights. Ultimately, improving website speed is less about chasing perfect scores and more about delivering a faster, smoother experience for your users.