


TL;DR: Confused why your website feels slow despite a good speed score? Learn the difference between website speed score vs real user experience, the factors causing the gap, and how to measure the performance more accurately.
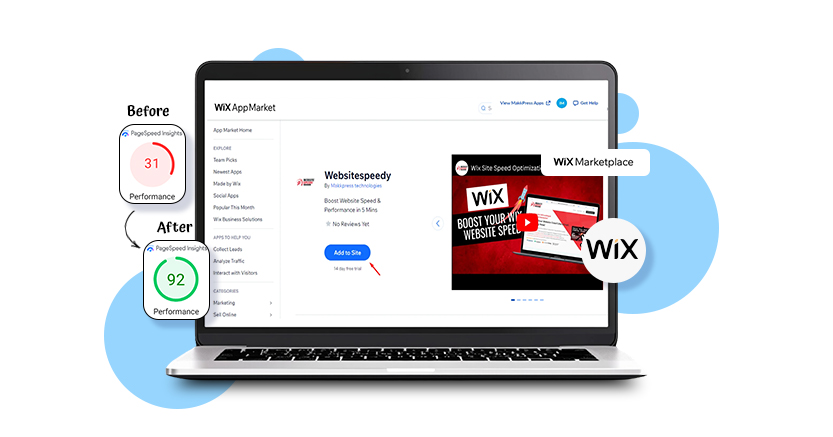
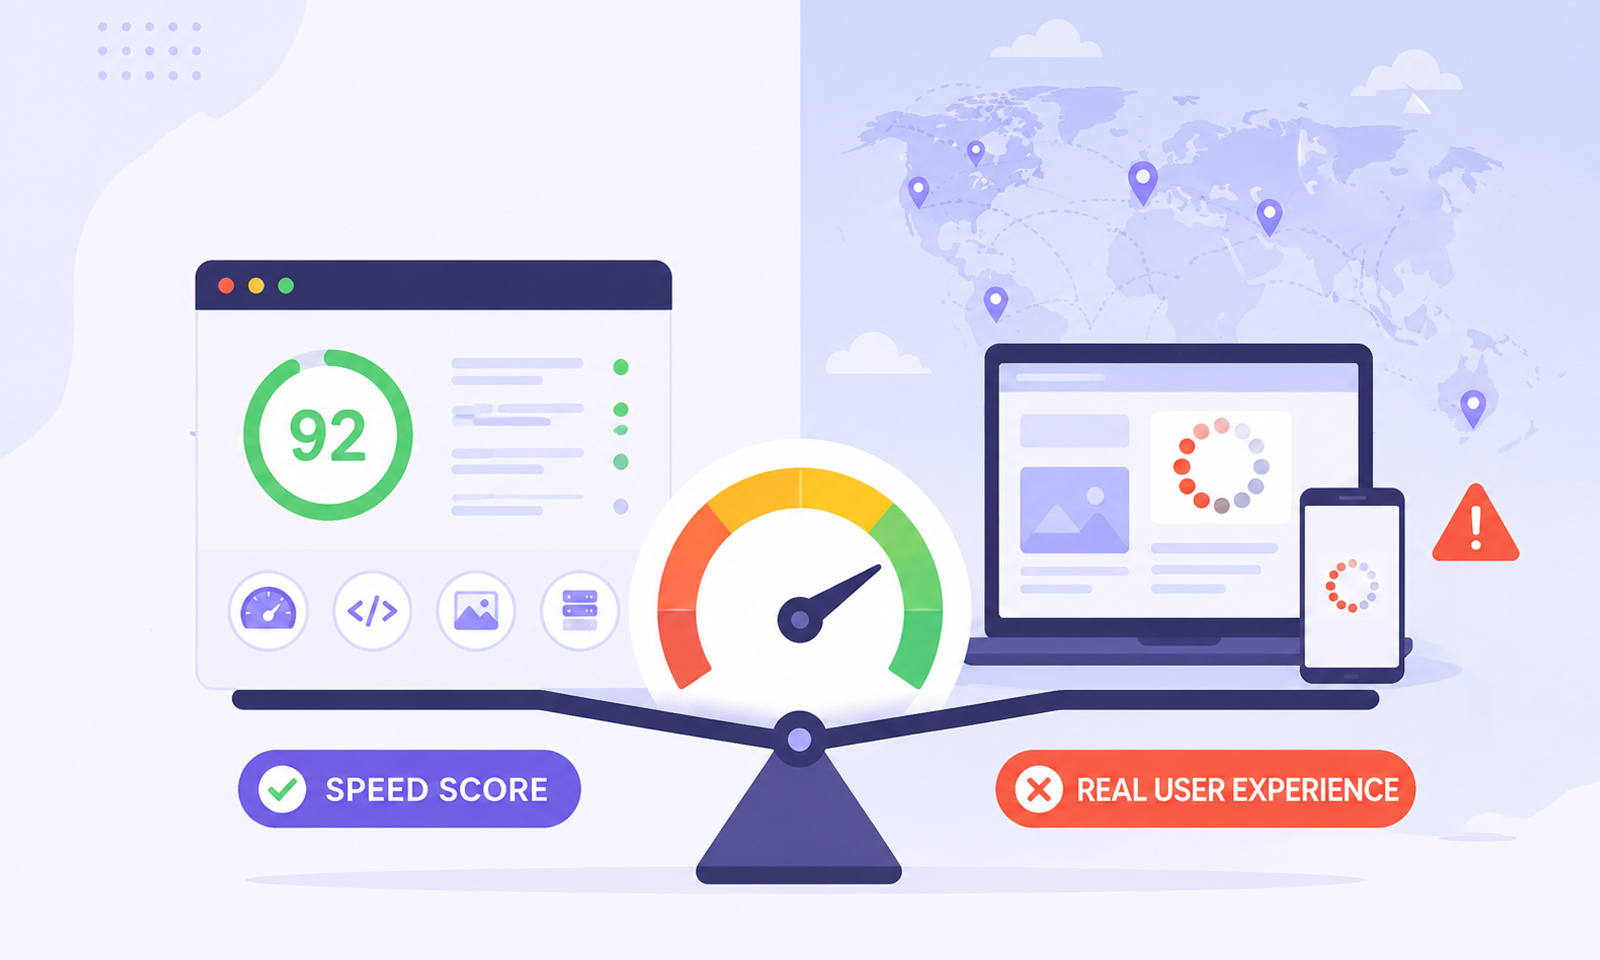
You run your website through Google PageSpeed Insights and get a score of 92. GTmetrix says performance looks excellent.
Yet visitors complain that pages feel sluggish, buttons take too long to respond, or the site simply feels slow. So what’s going on?
The reality is that a website speed score is not the same thing as real user experience. While performance tools provide valuable insights, they measure your site under controlled testing conditions. Real visitors experience your website in the real world, where internet speeds vary, devices differ dramatically, and countless external factors influence performance.
Understanding website speed score vs real user experience is essential because improving your score alone doesn’t always improve how fast your website actually feels.
Website Speed Score vs Real User Experience: What’s the Difference?
A website speed score measures performance in a controlled testing environment, while real user experience reflects how actual visitors perceive your site’s speed during everyday browsing.
Although both evaluate website performance, they focus on different aspects:
| Website Speed Score | Real User Experience |
|---|---|
| Based on simulated testing | Based on real visitors |
| Uses lab data | Uses field data |
| Measured during a single test | Measured across many sessions |
| Focuses on technical performance | Focuses on perceived speed and usability |
| Helpful for debugging | Helpful for understanding visitor satisfaction |
In simple terms, a speed score tells you how your website performs in a test, while real user experience reveals how your website performs for actual visitors.
This distinction is the core reason why a website can score highly in performance tools but still feel slow to users.
What Is a Website Speed Score?
A website speed score is a performance rating generated by tools such as:
- Google PageSpeed Insights
- Lighthouse
- GTmetrix
- WebPageTest
These tools analyze factors such as loading speed, render-blocking resources, image optimization, JavaScript execution, and caching.
Google PageSpeed Insights generates a performance score from 0 to 100 using Lighthouse lab tests. It may also display Chrome UX Report (CrUX) data, which reflects real-world user experiences when enough data is available. However, the performance score itself is still based on controlled lab testing, so it may not always reflect how every visitor experiences your website.
A high score is useful, but it is not a guarantee that every visitor experiences a fast website.
Why Website Speed Scores and Real User Experience Don’t Match
The biggest reason for the mismatch is simple:
Speed testing tools measure a simulation. Users experience reality.
A performance test might evaluate your website using predefined network conditions, a specific device profile, and a single page load scenario. Real visitors, however, arrive using hundreds of different device types, browser versions, network speeds, and geographic locations.
Google itself distinguishes between laboratory measurements and real-world user data because they often produce different results.
This explains why a website can achieve a strong Google PageSpeed Insights score while still receiving complaints about slow performance from actual users.
The score isn’t necessarily wrong. It’s simply measuring something different. This distinction is important because many website speed optimization efforts focus on improving test scores while overlooking the factors that affect actual users.
7 Reasons Your Website Speed Score Doesn’t Match Real User Experience
A good speed score doesn’t always translate into a fast user experience. Here are the most common reasons the two don’t always match.
1. Speed Tests Use Controlled Conditions
Most website performance tools rely on what Google calls “lab data.” Lab testing creates a repeatable environment so developers can identify issues consistently. This makes debugging easier, but it doesn’t perfectly represent real-world browsing conditions.
For example, a test might simulate a mid-tier mobile device on a stable network connection. Your actual visitors may be using older phones, weaker connections, or crowded networks.
This is one of the primary reasons website speed score vs real user experience often differs.
2. Real Users Have Different Devices
Not everyone visits your website using the latest smartphone or a powerful desktop computer. A page that performs well during testing may struggle on:
- Older Android devices
- Budget smartphones
- Low-memory tablets
- Aging laptops
Heavy JavaScript, large images, and complex animations often affect slower devices far more than performance testing environments suggest. As a result, visitors may perceive a website as slow even when performance scores remain high.
3. Network Speeds Vary Dramatically
Website testing tools typically use predefined network settings. Real users don’t. Some visitors browse on fiber connections, while others use:
- Public Wi-Fi
- Mobile networks
- Congested cellular connections
- Rural internet services
A page loading in two seconds during a test could take considerably longer for someone using a weaker connection.
When people search “why my website feels slow,” inconsistent network conditions are frequently part of the answer.
4. Third-Party Scripts Create Hidden Delays
Modern websites depend on numerous third-party services. These may include:
- Analytics platforms
- Chat widgets
- Advertising scripts
- Consent management tools
- Marketing automation software
Many of these scripts load after the initial page rendering process. Consequently, the page may appear fast in a speed test while users experience delayed interactions.
A high website speed score doesn’t always account for how these third-party resources affect the overall browsing experience.
5. Geographic Distance Affects Real Performance
The location where a test runs can significantly influence results. Imagine your website is hosted in North America.
A speed test conducted near the server may report excellent performance. However, visitors accessing the website from Asia, Europe, or Australia may experience higher latency and slower loading times.
Real user experience website speed is heavily influenced by the physical distance between users and servers. This is why content delivery networks (CDNs) are often critical for global websites.
6. User Interactions Reveal Problems Speed Scores Often Miss
Loading speed is only one part of performance. Visitors judge websites based on how quickly they can actually use them. A page may appear fully loaded while:
- Buttons remain unresponsive
- Menus lag during interaction
- Forms take time to react
- JavaScript blocks user actions
This is one reason Google introduced Interaction to Next Paint (INP) as a Core Web Vitals metric. Users care less about when a page looks loaded and more about when it becomes usable.
7. A Speed Score Is a Snapshot, Not a Continuous Experience
A website speed test captures a single moment. Users experience your website throughout the day. Performance can fluctuate because of:
- Traffic spikes
- Server resource limitations
- Database bottlenecks
- Third-party service delays
- Temporary infrastructure issues
A score generated at 9 a.m. may not accurately reflect visitor experiences during peak traffic hours. This is another reason website speed test accuracy has limitations when used as the only performance indicator.
Core Web Vitals vs PageSpeed Insights: Why the Difference Matters
Many website owners mistakenly focus entirely on the overall performance score. However, the discussion around Core Web Vitals vs PageSpeed Insights is important because Google evaluates user experience using more than a single number.
Core Web Vitals focus on real-world user experience through metrics such as:
Largest Contentful Paint (LCP): Measures how quickly primary content becomes visible.
Interaction to Next Paint (INP): Measures how responsive a page feels after user interactions.
Cumulative Layout Shift (CLS): Measures visual stability during page loading.
Unlike a Lighthouse performance score, these metrics are designed to reflect actual visitor experiences. That’s why a page can score above 90 and still struggle with real-world performance issues.
Lab Data vs Field Data: Which Should You Trust?
The debate around lab data vs field data often confuses because both measure website performance in different ways.
Lab Data Helps You Find Problems
Lab data is excellent for:
- Diagnosing performance issues
- Testing improvements
- Comparing changes after optimization
Field Data Shows Reality
Field data comes from actual user experiences collected over time. It reflects:
- Real devices
- Real networks
- Real locations
- Real browsing behavior
When evaluating real user experience website speed, field data is generally the more reliable indicator.
What Metrics Matter More Than Your Website Speed Score?
Instead of focusing solely on a website speed score, pay attention to these website performance metrics:
- Core Web Vitals: Measure real user experience through loading speed (LCP), responsiveness (INP), and visual stability (CLS).
- Field Data: Shows how actual visitors experience your website across different devices and networks.
- User Interaction Metrics: Reveal whether buttons, menus, forms, and other elements respond quickly after loading.
- Real User Monitoring (RUM): Tracks real-world performance data from actual visitors, helping uncover issues that speed tests may miss.
When speed scores and user feedback don’t align, these metrics usually provide a more accurate picture of your website’s performance.
Conclusion
The difference between a website speed score and real user experience comes down to one simple fact: speed testing tools measure simulated performance, while visitors experience your website under real-world conditions.
Speed scores provide valuable insights, but they represent controlled scenarios rather than everyday browsing conditions.
If your goal is to understand how fast your website truly feels, look beyond a single score. Focus on Core Web Vitals, field data, user interactions, and real user monitoring. Those metrics reveal the experience your visitors actually have, and that’s ultimately what matters most.