


TL;DR: High INP after JavaScript optimization usually means the problem lies elsewhere. This guide uncovers the most common hidden causes behind poor responsiveness, explains why Interaction to Next Paint is still high, and shows where to focus your troubleshooting efforts beyond JavaScript optimization.
Many site owners assume that once JavaScript is deferred, minified, split into smaller bundles, and unnecessary scripts are removed, INP issues should disappear.
Unfortunately, that’s not how INP works. Interaction to Next Paint (INP) measures the time between a user’s interaction and the next visual update on the screen. It evaluates the entire interaction lifecycle, including input delay, event processing, rendering, and painting.
This means your JavaScript may already be optimized, but the browser could still be struggling with rendering, layout calculations, DOM updates, or third-party code.
If you’re wondering why your Interaction to Next Paint is still high, the following hidden causes are often responsible.
Common Signs and Possible Causes of High INP
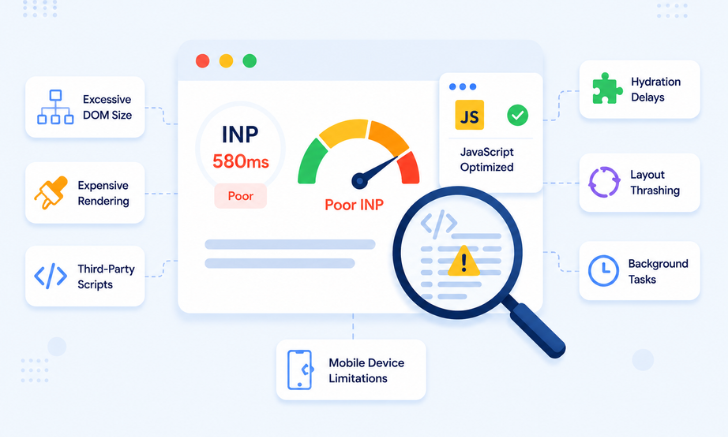
A high INP score after JavaScript optimization usually indicates that rendering, layout work, third-party scripts, hydration, or device-related limitations are slowing down interactions. Use the table below to quickly identify the most likely cause.
7 Hidden Causes Behind High INP After Optimizing JavaScript
Reducing JavaScript execution time is an important step, but it doesn’t eliminate every factor that can affect responsiveness. If your INP score remains high, one or more of the following hidden issues may be delaying interactions and preventing visual updates from appearing quickly.
1. Excessive DOM Size Is Slowing Down Interactions
One of the most overlooked causes of high INP after optimizing JavaScript is an oversized DOM. Every time a user interacts with a page, the browser may need to:
- Recalculate styles
- Recompute layouts
- Update affected elements
- Repaint portions of the page
If your page contains thousands of DOM nodes, these operations become expensive.
For example, a product category page with hundreds of filters, hidden elements, and dynamically injected content can experience delayed visual updates even when JavaScript execution is minimal.
What to check
- Large navigation menus
- Hidden modal content rendered on page load
- Infinite-scroll pages
- Complex page builders
Fix:
Reduce unnecessary DOM elements, especially hidden sections, oversized menus, and off-screen content. Consider lazy-rendering non-critical UI components so the browser has fewer elements to recalculate and repaint when users interact with the page.
2. Expensive Rendering and Repaints
Sometimes the interaction itself is fast, but the browser takes too long to render the visual update. Common culprits include:
- Large box shadows
- Heavy blur effects
- Complex CSS filters
- Animated gradients
- Large background images
For instance, clicking a button that triggers a visually complex animation may create a poor INP score even if the event handler completes quickly.
This is why developers often report poor INP after JavaScript optimization despite seeing lower Total Blocking Time.
What to check
Use Chrome DevTools Performance recordings and inspect rendering tasks that occur immediately after user interactions.
Fix:
Audit animations, shadows, filters, and large visual effects that trigger expensive paint operations. Where possible, use GPU-friendly properties such as transform and opacity, which generally require less rendering work than layout-affecting CSS properties.
3. Third-Party Scripts Are Blocking the Main Thread
Your code may be optimized, but third-party code often isn’t. Analytics tools, chat widgets, ad networks, A/B testing platforms, heatmaps, and tag managers frequently consume significant main-thread resources.
Many developers investigating INP troubleshooting discover that third-party scripts are responsible for interaction delays rather than their own application code. Community reports consistently identify analytics tags, advertising scripts, and tracking platforms as major contributors to poor INP scores.
Common offenders
- Google Tag Manager
- Live chat software
- Advertising networks
- Customer support widgets
- Behavioral analytics tools
Fix:
Review every third-party script and measure its impact in Chrome DevTools. Remove tools that provide little value, delay non-essential scripts until after user interaction, and load critical third-party resources asynchronously whenever possible.
Often, removing one unnecessary third-party tool produces a larger INP improvement than extensive JavaScript optimization.
4. Hydration Delays in Modern Frameworks
Frameworks like React, Next.js, Vue, Nuxt, and Gatsby can introduce hydration delays. A page may appear fully loaded, but interactive components are not actually ready until hydration completes.
This creates situations where:
- Users click buttons
- Inputs appear unresponsive
- Menus open slowly
The browser isn’t blocked by large JavaScript bundles anymore, it is busy connecting server-rendered HTML to client-side functionality. This issue has become increasingly common on highly interactive websites and eCommerce stores.
What to check
Monitor:
- Hydration timing
- Client-side rendering delays
- Component re-render frequency
Fix:
Prioritize making interactive elements usable sooner by reducing hydration work. Techniques such as selective hydration, server components, partial hydration, and island architecture can help prevent users from interacting with components that are not yet ready.
5. Layout Thrashing During User Interactions
Layout thrashing occurs when JavaScript repeatedly reads and writes layout properties.
For example:
element.style.width = “500px”;
const height = element.offsetHeight;
element.style.height = height + “px”;
The browser is forced to recalculate layouts multiple times.
Even if the script itself is small, the resulting layout work can significantly increase INP.
Symptoms
- Dropdown menus feel sluggish
- Search suggestions lag
- Filters update slowly
- Accordions hesitate before opening
Fix:
Group layout reads and writes together instead of alternating between them. Tools like Chrome DevTools can help identify forced reflow warnings and pinpoint the code responsible for repeated layout calculations.
6. Background Tasks Competing for Browser Resources
Not every INP issue happens directly during an interaction. Sometimes, background work is already occupying the main thread when a user clicks.
Examples include:
- Data synchronization
- Analytics processing
- Lazy-loading operations
- Long-running timers
- State management updates
Google notes that INP measures responsiveness throughout the entire page lifecycle, not just during initial load. Since users spend most of their time interacting with a page after it loads, background tasks can significantly influence responsiveness.
What to check
Record real user sessions and inspect long tasks occurring immediately before slow interactions.
Fix:
Identify long-running background tasks and split them into smaller operations. Schedule non-essential work during browser idle time so user interactions receive priority when they occur.
7. Mobile Devices Expose Problems Hidden on Desktop
A site that feels instant on a high-end desktop may struggle on mobile devices. This is one of the biggest reasons site owners wonder why Interaction to Next Paint is still high despite passing internal tests.
Mobile devices face:
Real-world performance data consistently shows a significant gap between desktop and mobile INP scores because mobile hardware has fewer resources available for rendering and interaction processing.
How to Fix
Evaluate performance using real-user data and test on mid-range mobile devices rather than relying solely on desktop audits. This helps uncover interaction delays that only appear on slower hardware and real-world network conditions.
If none of the issues above are obvious, the next step is identifying which stage of the interaction lifecycle is creating the delay.
How to Diagnose the Real Cause of High INP
If you’re trying to fix a high INP score, the first step is identifying where the delay occurs during the interaction lifecycle. A slow interaction may be caused by JavaScript, rendering, layout recalculations, third-party scripts, or background browser tasks.
Start by checking your INP score in PageSpeed Insights and then use Chrome DevTools Performance recordings to analyze slow interactions and pinpoint the source of the delay.
While Lighthouse is useful for performance testing, it primarily evaluates page-load behavior and uses Total Blocking Time (TBT) as a proxy rather than measuring real-world INP directly.
For more effective INP troubleshooting, use:
The key is to identify whether the delay comes from JavaScript, rendering, layout work, or other browser processes before attempting a fix.
Conclusion
If your INP is high after optimizing JavaScript, the cause often extends beyond JavaScript execution itself. Factors such as rendering delays, DOM complexity, third-party scripts, hydration, background tasks, and mobile-device limitations can all impact responsiveness.
The key is to identify where the delay occurs in the interaction lifecycle rather than focusing solely on JavaScript. Once you pinpoint the underlying cause, improving Interaction to Next Paint becomes a much more targeted and effective process.