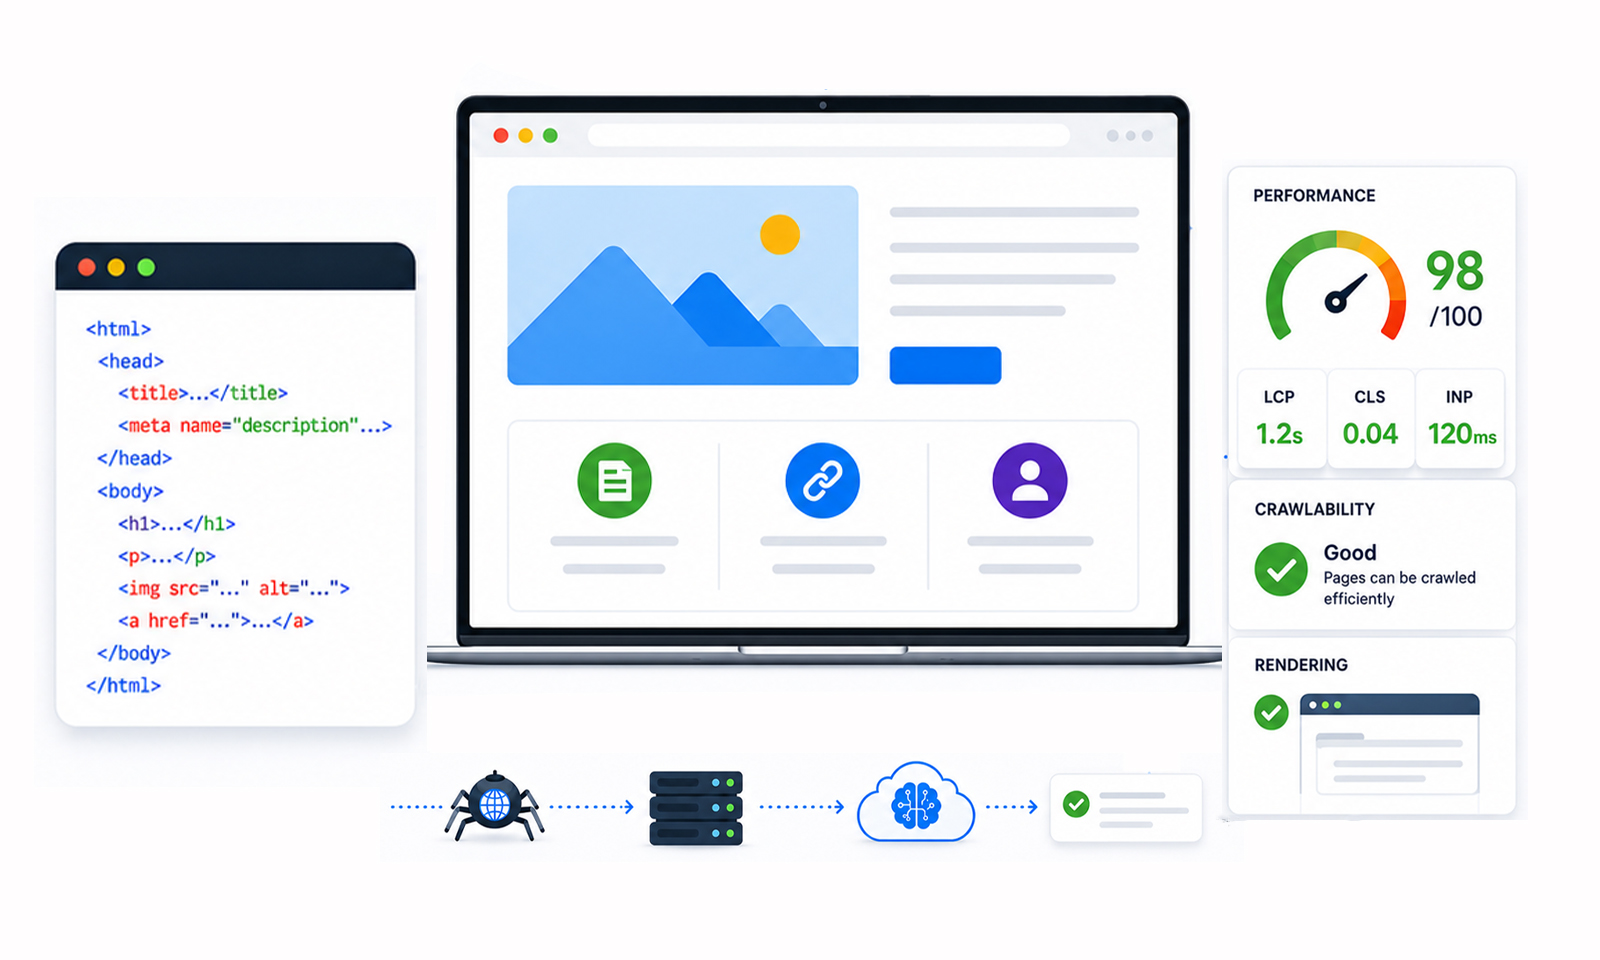




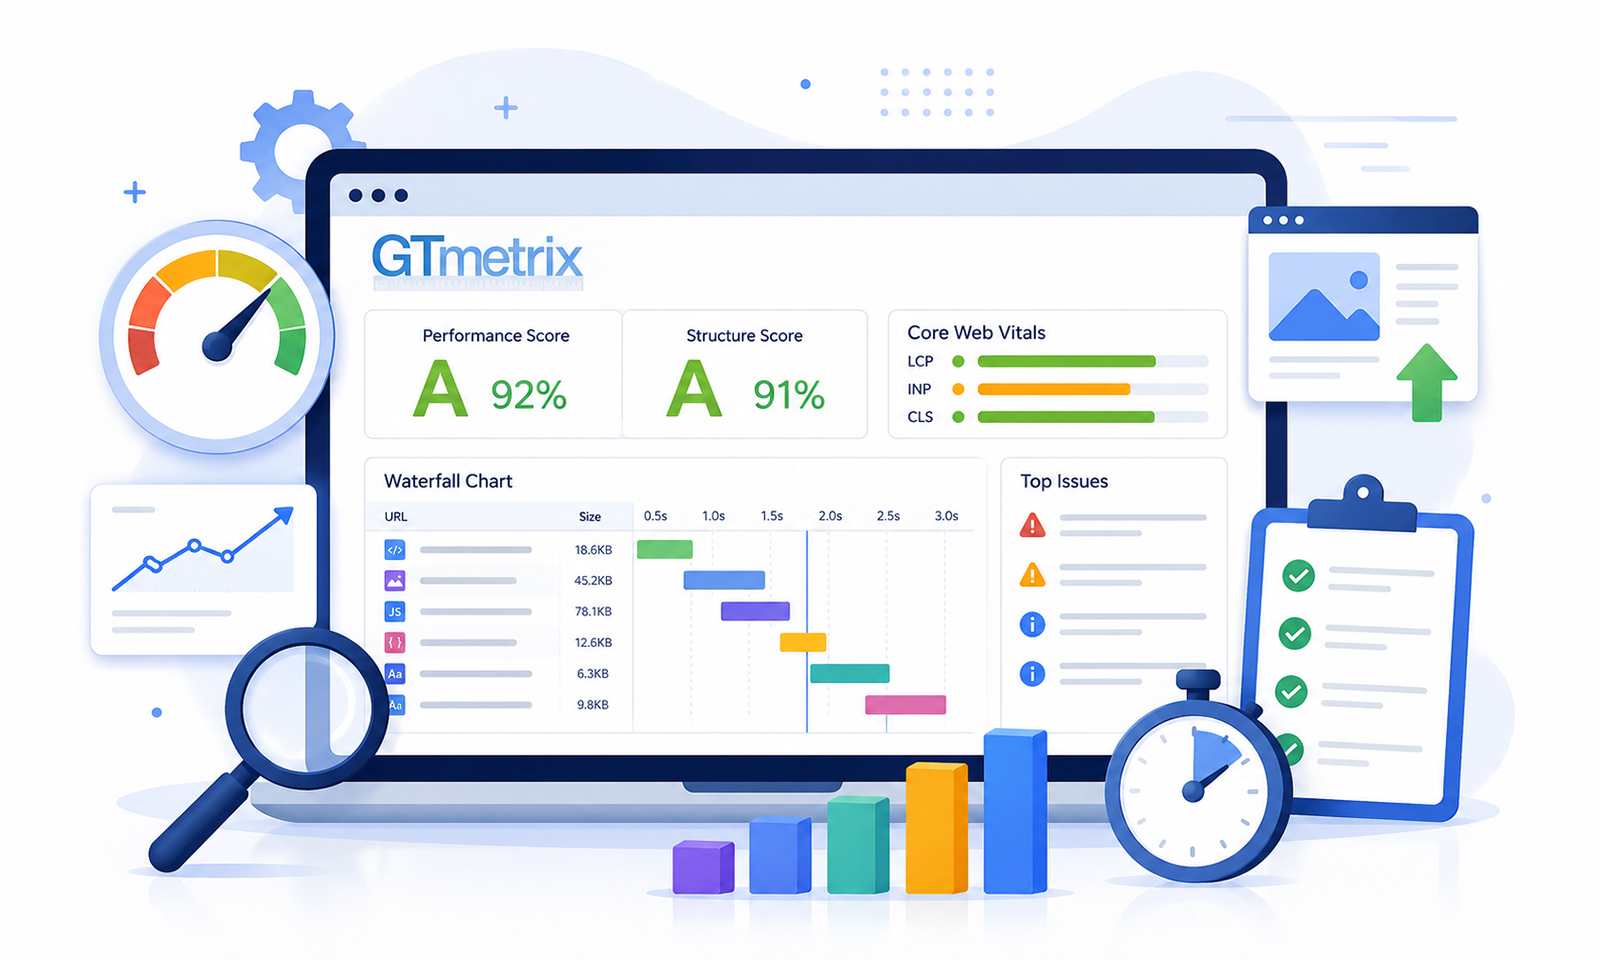
TL;DR: A GTmetrix report helps you understand website loading speed, Core Web Vitals, and issues affecting your site’s performance. Focus on LCP, INP, CLS, the waterfall chart, and actionable recommendations rather than chasing a perfect GTmetrix score.
Running a website speed test is easy. Knowing what the results actually mean is where most people get stuck.
If you’ve opened a GTmetrix report and found yourself staring at performance scores, waterfall charts, and dozens of recommendations, you’re not alone. Many website owners focus on improving a single score without understanding which issues have the biggest impact on website loading speed, user experience, and SEO.
A high score isn’t always the full story, either. It’s entirely possible to earn an excellent GTmetrix grade while your website still feels slow to real visitors due to server delays, third-party scripts, or mobile performance issues.
This beginner-friendly guide will walk you through a complete GTmetrix report analysis, explaining what each section means, which GTmetrix performance metrics deserve your attention, and how to turn performance data into practical website speed optimization improvements.
Quick Overview: How to Do a GTmetrix Report Analysis
If you’re wondering how to read a GTmetrix report, follow these five steps:
- Review the Performance and Structure Scores to get a high-level overview of your page’s health.
- Check the Core Web Vitals (LCP, INP, and CLS), as these have the greatest impact on user experience and search performance.
- Analyze the Page Details to identify large page sizes, excessive requests, or unusually long load times.
- Inspect the Waterfall Chart to pinpoint slow-loading resources, render-blocking files, third-party scripts, or server delays.
- Prioritize GTmetrix Recommendations based on their real impact rather than aiming for a perfect 100/100 score.
The goal of a GTmetrix report analysis isn’t to chase the highest score, it’s to understand what’s slowing your website and fix the issues that matter most for real users.
What Is a GTmetrix Report?
A GTmetrix report is a detailed website performance analysis that examines how quickly your pages load and what causes delays. It combines Lighthouse data with GTmetrix’s own visualization tools, making it useful for both beginners and experienced developers.
When you run a website speed test, GTmetrix shows:
- Performance Score
- Structure Score
- Core Web Vitals
- Page size and requests
- Waterfall chart
- Performance recommendations
Understanding GTmetrix Performance and Structure Scores
Before diving into a detailed GTmetrix report analysis, it’s important to understand that your score is made up of different factors, and it may not remain exactly the same every time you run a test.
The GTmetrix Performance Score measures how your page performs based on Lighthouse metrics such as LCP, INP, CLS, Speed Index, and Total Blocking Time. Along with this, GTmetrix also provides a Structure Score, which evaluates how well your website follows recommended technical optimization practices.
Unlike the Performance Score, which focuses on measured loading behavior, the Structure Score highlights possible improvement areas such as inefficient resource loading, unnecessary requests, and configuration issues.
A lower Structure Score does not always mean your website is slow. However, it can reveal technical areas that may affect performance over time and should be optimized.
Why Does My GTmetrix Score Change?
GTmetrix scores can vary between tests because website performance depends on multiple factors, including server load, testing location, network conditions, caching status, and third-party resources loading during the test.
For more accurate comparisons, run multiple tests under similar conditions and focus on consistent performance patterns rather than a single score. The goal is not just to improve the number but to identify and fix the issues affecting real user experience.
How Do I Read a GTmetrix Report?
A successful GTmetrix report analysis isn’t about looking at one score and calling it a day. Instead, work through the report section by section. Start with the overall summary to understand your site’s health, then drill down into the metrics and recommendations that explain why your page loads the way it does.
A GTmetrix report is divided into several sections that help you diagnose different performance issues:
- Summary
- Performance
- Structure
- Waterfall
- Video
- History
The five sections below will help you understand exactly what GTmetrix is telling you and where you should focus your optimization efforts.
Step 1: Check the GTmetrix Score
The first thing you’ll notice is your GTmetrix Score, which provides a quick snapshot of your website’s overall performance. This score is calculated using Google Lighthouse and reflects how well your page performs based on several important GTmetrix performance metrics.
These metrics include:
- Largest Contentful Paint (LCP)
- Interaction to Next Paint (INP)
- Cumulative Layout Shift (CLS)
- Speed Index
- Total Blocking Time (TBT)

What does the GTmetrix score mean?
| Score | Meaning |
|---|---|
| A (90–100) | Excellent performance |
| B (80–89) | Good performance with minor improvements possible |
| C (70–79) | Average performance that needs optimization |
| Below 70 | Significant performance issues affecting users |
While the score provides a useful overview, it should never be your only focus. Two websites with the same GTmetrix score can deliver completely different user experiences.
For example, many sites with good GTmetrix grades still perform poorly for real users because of slow server response, heavy third-party scripts, or network latency. This is why it’s important to analyze the underlying metrics instead of chasing a perfect score.
Step 2: Understand Core Web Vitals
After reviewing the overall score, move to the Core Web Vitals section. These are Google’s primary user experience metrics and play an important role in evaluating how visitors experience your website.

| Metric | Good Target |
|---|---|
| LCP | Under 2.5s |
| INP | Under 200ms |
| CLS | Under 0.1 |
Rather than treating these numbers as technical jargon, think of them as answers to three simple questions:
- How fast does the page appear? (LCP)
- How quickly does it respond to interactions? (INP)
- Does the layout stay stable while loading? (CLS)
Largest Contentful Paint (LCP)
LCP measures how long it takes for the largest visible element, often a hero image, banner, or heading to appear on the screen. Since this is usually the first thing visitors notice, a slow LCP can make an entire website feel sluggish.
Common reasons for poor LCP include:
- Oversized images that haven’t undergone image optimization
- Slow server response times
- Render-blocking CSS and JavaScript
- Missing caching or CDN configuration
Interaction to Next Paint (INP)
INP measures how quickly your website responds after a visitor clicks, taps, or interacts with the page. A poor INP doesn’t necessarily make a page load slowly, but it makes the website feel slow because user interactions are delayed.
High INP is commonly caused by:
- Heavy JavaScript execution
- Multiple third-party scripts
- Long-running tasks on the browser’s main thread
Reducing unnecessary JavaScript, delaying non-essential scripts, and optimizing third-party integrations are some of the most effective ways to improve this metric.
Cumulative Layout Shift (CLS)
CLS measures visual stability. If content unexpectedly moves while the page is loading, causing users to click the wrong button or lose their reading position, your CLS score will increase.
Layout shifts are often caused by:
- Images without predefined width and height
- Ads or embedded content loading after the page
- Web fonts swapping during rendering
- Dynamic banners inserted above existing content
Step 3: Review the Page Details

Once you’ve analyzed the Core Web Vitals, move to the Page Details section. This provides an overview of the resources your page loads and how efficiently they’re delivered.
You’ll typically see information such as:
- Total page size
- Number of HTTP requests
- Fully loaded time
Although every website is different, a well-optimized page generally aims for:
- Page size approximately under 2 MB
- Fewer HTTPs requests
- Load time below 3 seconds
If your page size is significantly larger than these benchmarks, it’s often a sign that your page weight is too high. Large images, videos, unused CSS, oversized fonts, and unnecessary JavaScript files are common contributors.
Images are frequently responsible for more than half of a webpage’s total size, making image optimization one of the fastest ways to reduce loading times.
Step 4: Analyze the Waterfall Chart

The waterfall chart is one of the most valuable parts of any GTmetrix report analysis because it shows exactly how every resource on your page loads.
Instead of only telling you that your website is slow, it reveals which files are slowing it down and why.
Each row represents an individual resource, such as an image, stylesheet, JavaScript file, or font, and the timeline shows how long each one takes to connect, download, and render.
What to look for
| Issue | What It Usually Indicates |
|---|---|
| Long waiting (purple) bars | Slow server response or high TTFB |
| Large image downloads | Images need compression or resizing |
| Multiple JavaScript files | Excessive JavaScript execution |
| Long CSS downloads | Render-blocking CSS |
Real-world example
Imagine your homepage takes five seconds to load.
The waterfall chart might reveal:
- 1.8 seconds waiting for the server to respond
- 1.2 seconds downloading an oversized hero image
- 800 milliseconds loading analytics and marketing scripts
- 600 milliseconds downloading unused CSS
Instead of guessing what needs fixing, you now have a clear roadmap. In this example, your priorities would be:
- Improve server response time.
- Compress and properly size the hero image.
- Reduce or delay unnecessary third-party scripts.
- Eliminate render-blocking CSS and unused styles.
This systematic approach saves time and delivers much better performance improvements than making random optimizations.
Use the GTmetrix Video Feature
The video view shows how your page visually loads from the visitor’s perspective. It helps identify issues such as blank screens, delayed hero images, or content appearing too late, even when technical metrics look acceptable.
Step 5: Prioritize GTmetrix Recommendations

Finally, review the Recommendations section. GTmetrix identifies optimization opportunities based on your test results and explains which improvements are likely to have the greatest impact.
Some of the most common recommendations include:
- Optimize images
- Enable browser caching
- Reduce unused CSS
- Eliminate render-blocking resources
- Defer non-critical JavaScript
- Use a CDN
- Reduce HTTP requests
- Minimize third-party scripts
Treat these suggestions as a priority list rather than a checklist. Focus first on recommendations that improve Core Web Vitals, reduce page weight, and eliminate major rendering bottlenecks before spending time on smaller optimizations. These recommendations directly support website speed optimization.
GTmetrix and PageSpeed Insights: Which Is Better?
One of the most common questions website owners ask is, “Is GTmetrix better than PageSpeed Insights?” The short answer is that both tools are valuable, but they serve different purposes. Understanding their strengths will help you perform a more accurate page speed analysis and avoid relying on a single performance report.
| Feature | GTmetrix | PageSpeed Insights |
|---|---|---|
| Waterfall chart | Excellent | Limited |
| Real-user data | Limited | Strong |
| Core Web Vitals | Yes | Yes |
| Developer diagnostics | Excellent | Good |
| SEO-focused insights | Good | Excellent |
Best approach
Rather than choosing one tool over the other, use them together.
GTmetrix excels at identifying technical bottlenecks with features like the waterfall chart, making it easier to diagnose issues such as slow server responses, render-blocking resources, and large assets.
PageSpeed Insights, on the other hand, combines lab data with Google’s real-user data (Chrome User Experience Report), helping you understand how your website performs for actual visitors.
Using both tools gives you a more complete picture of your website’s performance.
The 5 Metrics Beginners Should Prioritize
A GTmetrix report contains dozens of performance metrics, but beginners don’t need to analyze every number at once. Focusing on a few high-impact metrics will help you improve website loading speed faster and avoid getting overwhelmed.
If you only remember five things from this guide, focus on these:
- LCP under 2.5 seconds – Ensures the main content appears quickly.
- INP under 200 milliseconds – Keeps your website responsive to user interactions.
- CLS under 0.1 – Prevents unexpected layout shifts while the page loads.
- Page size approximately under 2 MB – Reduces download time and improves mobile performance.
- Fewer HTTP requests – Minimizes the number of resources the browser must load.
Improving these five areas usually delivers the biggest gains in website speed optimization, user experience, and Core Web Vitals. Once these fundamentals are in good shape, you can move on to more advanced optimizations to further enhance your site’s performance.
Conclusion
A good GTmetrix report analysis is not about chasing a perfect score. It is about understanding why a page is slow and fixing the issues that affect real visitors.
Start with Core Web Vitals, inspect the waterfall chart, optimize images, reduce unnecessary scripts, and eliminate render-blocking resources. Those changes usually deliver far more value than obsessing over a few extra points on a speed test.
FAQs
1. What is a GTmetrix report?
2. How do I read a GTmetrix report?
3. What does the GTmetrix score mean?
4. Is GTmetrix better than PageSpeed Insights?
5. What is a good GTmetrix score?
6. Why is my GTmetrix score good but my site still feels slow?
About the Author