


TL;DR: If your website feels slow despite a good GTmetrix score, you’re not imagining it. Performance tests and real user experiences often tell different stories. In this article, you’ll learn what GTmetrix doesn’t fully capture, the hidden issues affecting visitors, and how to evaluate website performance more accurately.
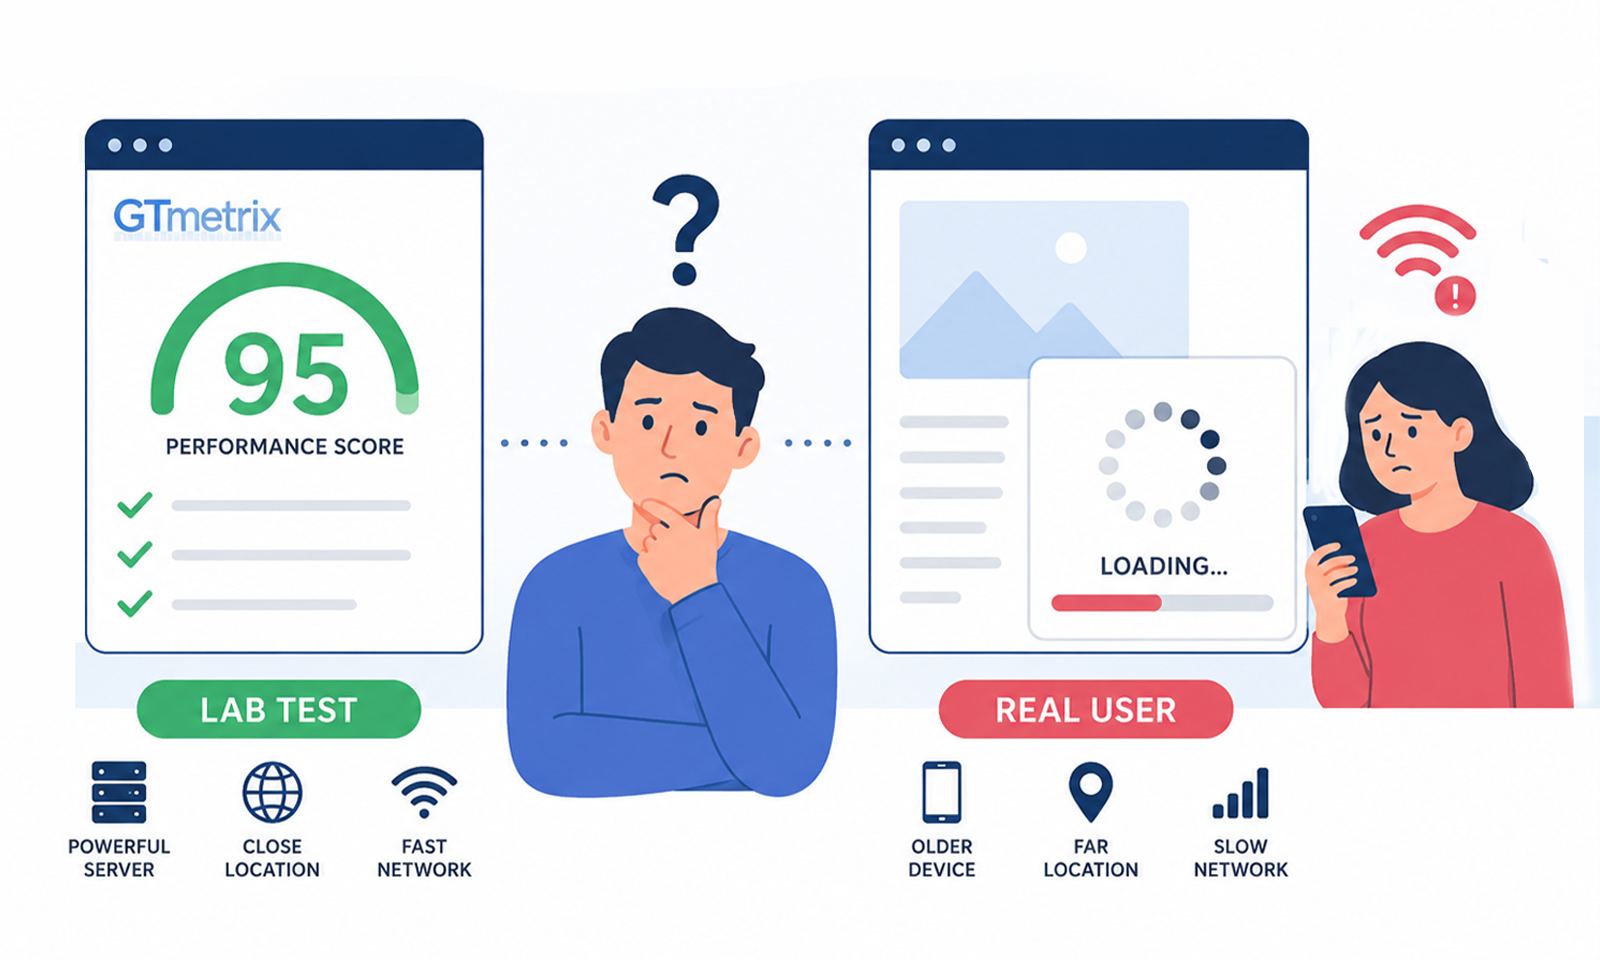
Many website owners have experienced this scenario. You run a GTmetrix test and receive a performance score in the 90s. The report looks excellent, and most recommendations are marked as passed. Yet customers complain that pages load slowly, mobile visitors bounce quickly, and the website simply doesn’t feel responsive.
This is a common situation where GTmetrix reports an excellent score, but real visitors still experience a slow website.
If this sounds familiar, you’re not alone. The issue is that a page speed score vs actual speed is not always the same thing. GTmetrix is an excellent diagnostic tool, but it does not fully replicate how thousands of real users experience your website every day.
Understanding this difference is essential for effective website speed optimization beyond GTmetrix.
The Real Reason Visitors Experience Delays
The table below highlights why a website can earn a high GTmetrix score while still feeling slow to real visitors under everyday browsing conditions.
| GTmetrix Shows a Good Score Because… | But Users May Still Experience Slowness Because… |
|---|---|
| Tests are run in a controlled environment | Visitors use different devices, browsers, and networks |
| Performance is measured at a single point in time | Traffic spikes can slow server response times |
| Test locations may be close to the server | Users may access the site from other regions |
| Loading metrics are prioritized | Interaction delays and responsiveness issues can remain |
| Technical performance looks strong | Real-world Core Web Vitals may still need improvement |
Understanding GTmetrix: What It Actually Measures
GTmetrix uses Google Lighthouse as its primary testing engine while adding its own performance reports, waterfall analysis, and historical tracking. Like other lab-testing tools, it loads your website under predefined conditions and evaluates various performance metrics.
This approach is useful because it provides consistent and repeatable results. Developers can identify technical issues and measure improvements after changes are made. However, lab testing has limitations.
Google explains that lab data is collected using a specific device, network configuration, and geographic location. Real users, on the other hand, visit your website using countless combinations of devices, internet speeds, and browsing behaviors.
Think of it this way:
| Lab Testing | Real User Experience |
|---|---|
| Controlled environment | Real-world conditions |
| Single location | Multiple locations |
| Simulated device | Thousands of device types |
| One test session | Continuous user interactions |
| Ideal scenarios | Unpredictable scenarios |
This difference explains much of the gap between a strong GTmetrix score and a slow user experience.
Why GTmetrix Score vs Real User Experience Often Don’t Match
Even after understanding how GTmetrix works, it’s important to know why its results don’t always match what real visitors experience. Lab tests measure performance under controlled conditions, while every visitor accesses your website using different devices, browsers, internet connections, and locations. That’s why a website can earn an excellent GTmetrix score yet still feel slow to some users.
As a result, a website can achieve an excellent GTmetrix score but still feel slow to users. Factors such as mobile device limitations, geographic distance from the server, third-party scripts, and traffic spikes can affect real-world performance in ways that a single test may not fully capture.
This is why website speed optimization should focus not only on benchmark scores but also on how actual visitors experience the site.
| GTmetrix Measures | Real Users Experience |
|---|---|
| Controlled testing environment | Different devices and browsers |
| Single test location | Global visitor locations |
| Simulated network conditions | Real internet speeds |
| One-time performance snapshot | Performance throughout the day |
| Technical benchmarks | Actual usability and responsiveness |
GTmetrix Score vs Real User Experience
The difference between GTmetrix scores and real user experience comes down to one simple fact: synthetic testing and real-world browsing are fundamentally different.
Google’s field data comes from real users and powers metrics such as Core Web Vitals. This data reflects how visitors actually experience your website over time. Google’s documentation specifically notes that field data is generally the most accurate representation of user experience.
A visitor using a three-year-old Android device on a crowded mobile network may have a dramatically different experience than the environment used in a GTmetrix test.
In many cases, GTmetrix gives a good score, but the website is still slow; the root cause is not page weight or image optimization but differences between testing conditions and real-world usage.
Signs Your GTmetrix Score May Be Misleading
Even if GTmetrix reports a score above 90, users may still experience performance issues. Common warning signs include:
| Symptom | Possible Cause |
|---|---|
| Mobile visitors complain about slowness | Device limitations |
| High bounce rate despite good scores | Rendering delays |
| Slow checkout process | Dynamic content bottlenecks |
| International visitors report issues | Geographic latency |
| Buttons feel sluggish | Poor INP |
Understanding why a GTmetrix good score, but the website is still slow, situation occurs requires looking beyond benchmark scores and identifying the factors that affect actual visitors.
6 Website Speed Issues GTmetrix Doesn’t Fully Reveal
Even when GTmetrix reports excellent performance, certain real-world factors can still make a website feel slow because they are difficult to measure accurately in a controlled testing environment.
1. Slow Server Response During Traffic Spikes
GTmetrix usually tests your website at a single point in time. Real visitors may arrive during peak traffic periods when hosting resources are stretched.
Under these conditions, Time to First Byte (TTFB) can increase significantly, causing pages to feel sluggish even when static assets are optimized. This is one of the most overlooked reasons a website can feel slow despite a strong GTmetrix score.
2. Mobile Devices Are Slower Than Test Environments
Many websites are optimized for desktop performance but struggle on mobile devices. A page may render quickly on a powerful computer while becoming noticeably slower on older smartphones.
Since mobile traffic accounts for the majority of web traffic for many businesses, mobile responsiveness often has a greater impact on perceived speed than desktop benchmark scores.
3. Third-Party Scripts Continue Loading After Initial Render
Marketing tags, analytics platforms, chat widgets, review systems, heatmaps, and advertising scripts can slow down your website.
GTmetrix may report a smooth loading sequence, but visitors can still experience delays because these scripts continue consuming browser resources after the page appears to be loaded.
This often impacts INP (Interaction to Next Paint), one of Google’s Core Web Vitals metrics. A good INP score should remain below 200 milliseconds.
4. Geographic Distance From the Server
A GTmetrix test location may be physically close to your hosting infrastructure. Real visitors may be thousands of miles away.
Without a properly configured CDN, those users experience longer network latency, slower resource delivery, and increased loading times.
5. Logged-In Experiences Are Often Slower
Most performance tests evaluate public pages. Actual users may browse account dashboards, shopping carts, product filtering systems, or membership areas that generate dynamic content.
These sections frequently perform much more slowly than pages measured in speed-testing tools.
6. User Interactions Are Not Fully Captured
A page may load quickly but become sluggish when users click buttons, open menus, submit forms, or navigate filters. Modern performance is no longer just about loading speed. Google’s Core Web Vitals now focus on:
- LCP (Largest Contentful Paint) – loading performance
- INP (Interaction to Next Paint) – responsiveness
- CLS (Cumulative Layout Shift) – visual stability
These metrics are based on real user experiences rather than a single synthetic test.
What Should You Measure Instead?
If your website feels slow despite a high GTmetrix score, relying only on lab data makes it harder to identify the real cause.
Check Core Web Vitals
Google Search Console and PageSpeed Insights provide real-world performance data based on actual user visits.
Focus on:
| Metric | Good Threshold |
|---|---|
| LCP | Under 2.5 seconds |
| INP | Under 200 ms |
| CLS | Under 0.1 |
These thresholds are used within Google’s Core Web Vitals framework.
Compare Lab Data and Field Data Together
The most accurate performance analysis comes from comparing both lab data and field data.
| Tool | Best For |
|---|---|
| GTmetrix | Technical diagnostics |
| Lighthouse | Development testing |
| PageSpeed Insights | Combining lab and field data |
| Search Console | Core Web Vitals trends |
| CrUX | Real-user performance data |
Review Real User Monitoring (RUM)
RUM tools collect data directly from your visitors, it often uncover performance issues that synthetic tests cannot reproduce.
Test From Multiple Locations
Evaluate performance from regions where your audience is located. A website serving visitors in North America, Europe, and Asia may perform very differently across those regions.
This is why an experienced website speed optimizer typically evaluates both synthetic test results and real-user performance data before recommending improvements.
A Better Approach to Website Speed Optimization Beyond GTmetrix
GTmetrix should be viewed as a starting point, not the final verdict.
An effective performance strategy combines:
- GTmetrix for diagnostics
- PageSpeed Insights for field data
- Google Search Console for Core Web Vitals monitoring
- Real User Monitoring tools
- Ongoing server and CDN optimization
A focused website speed optimization can work on both technical metrics and user perception.
After all, visitors do not care whether a page scores 98 or 100 in GTmetrix. They care whether it loads quickly, responds instantly, and allows them to complete their goals without frustration.
Conclusion
If you’re dealing with a GTmetrix good score but a website is still slow, the key takeaway is that performance scores and user experience are not always the same thing. GTmetrix is valuable for identifying technical improvements, but it cannot fully replicate the wide variety of devices, networks, locations, and interactions experienced by actual visitors.
The most reliable way to evaluate performance is to combine GTmetrix insights with real user data, Core Web Vitals, and ongoing monitoring. When you focus on how people actually experience your website, not just how a testing tool scores it, you gain a much clearer picture of what truly needs improvement.