


TL;DR: Optimizing images doesn’t always fix a high LCP score. In this guide, you’ll learn why LCP can remain slow even after image optimization, how to diagnose the underlying issue, and the most effective ways to reduce loading and rendering delays that impact Core Web Vitals.
If you’ve already compressed images, converted them to WebP, resized oversized assets, and enabled responsive images, but you’re still seeing a high LCP after optimizing images, you’re not alone.
This is one of the most common frustrations with Core Web Vitals. Many site owners assume images are always the primary cause of poor Largest Contentful Paint scores. While images often contribute to LCP problems, they are far from the only factor.
In fact, Google also shows that Largest Contentful Paint is influenced by multiple stages of the loading process, including server response time, resource discovery, JavaScript execution, CSS rendering, and browser main-thread activity, not just image size.
The result? You may have perfectly optimized images while your LCP remains stubbornly high. This blog uncovers 10 hidden causes that can keep Largest Contentful Paint high even after image optimization and explains exactly how to fix each one.
The 10 Hidden Reasons & Fixes of High LCP After Optimizing Images
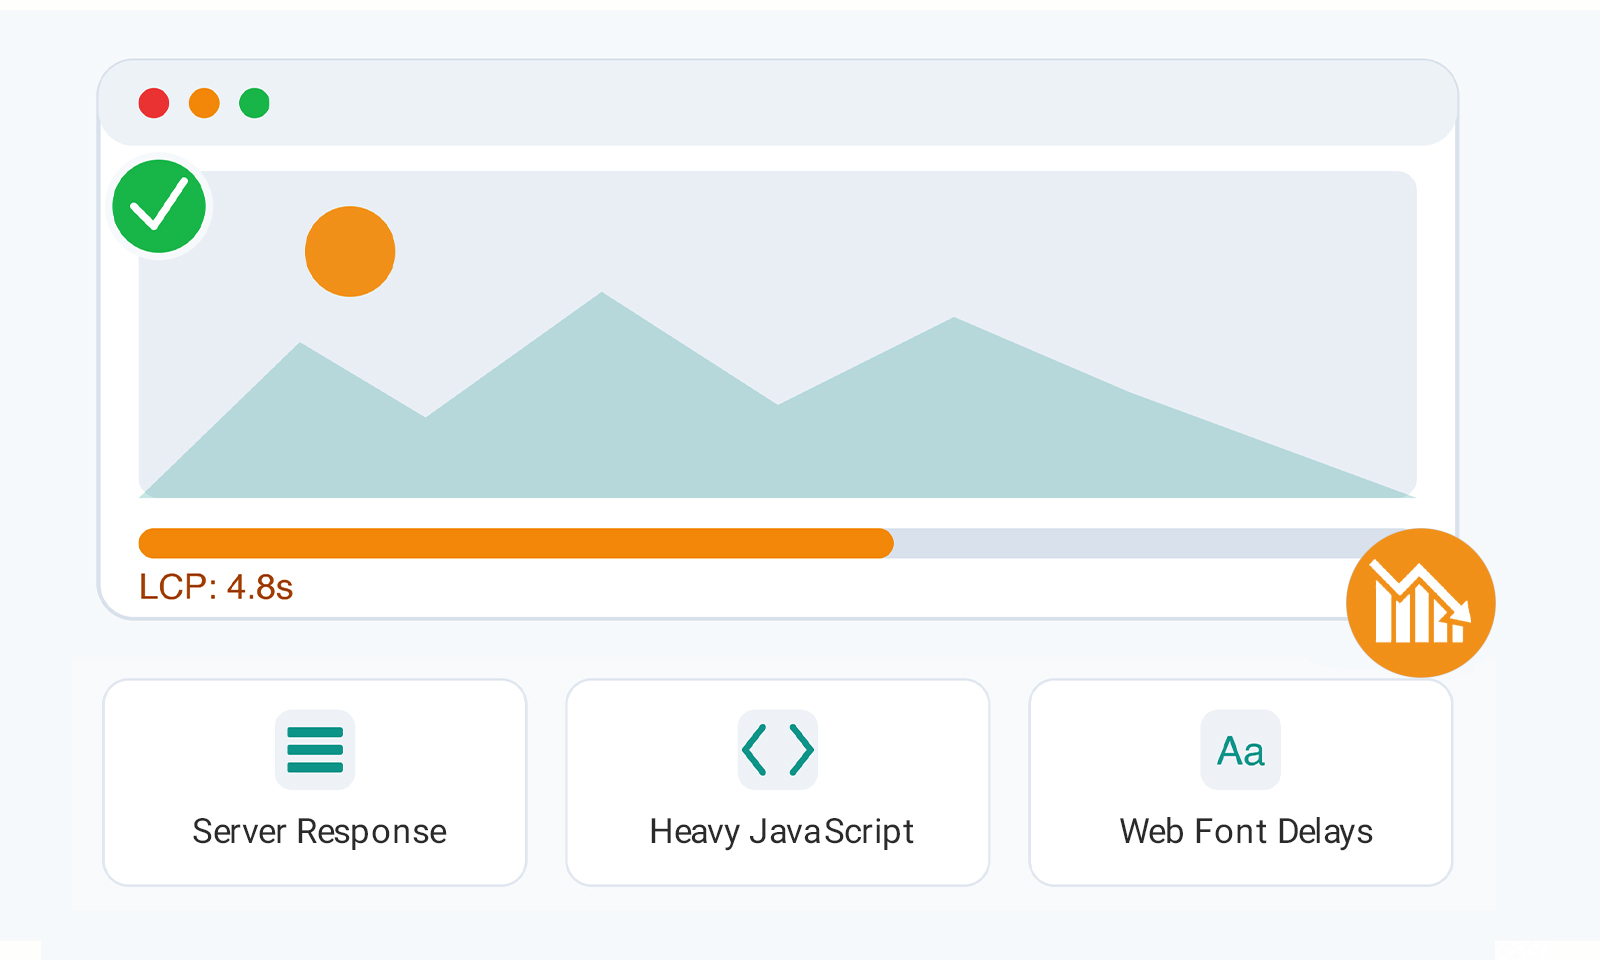
If your LCP is still high after optimizing images, the problem is usually caused by slow server response times, render-blocking CSS, JavaScript execution, delayed resource discovery, or other rendering issues, rather than the image itself.
Key takeaway: If you have high LCP after optimizing images, the issue is usually related to server performance, CSS, JavaScript, or rendering delays, not image size alone.
What Is the Largest Contentful Paint (LCP)?
Largest Contentful Paint (LCP) is a Core Web Vitals metric that measures how long it takes for the largest visible piece of content on a page to load and become visible to users. In simple terms, it helps determine when visitors can actually see the main content of a page rather than just a blank screen or loading elements.
Depending on the page layout, the LCP element is typically one of the following:
- A hero image
- A featured image
- A large heading or text block
- A banner section
- A video poster image
For example, if a blog post displays a large featured image at the top of the page, that image will often become the LCP element. On a text-focused landing page, the main headline may be the element measured by LCP.
Google recommends keeping LCP at 2.5 seconds or less to provide a good user experience. An LCP between 2.5 and 4 seconds needs improvement, while anything above 4 seconds is considered poor. Since LCP directly reflects how quickly users can see meaningful content, it has become one of the most important performance metrics for evaluating real-world page performance.
Why Image Optimization Doesn’t Always Improve LCP
The biggest misconception in performance optimization is assuming that image compression automatically fixes LCP. Google breaks LCP into multiple phases:
A delay in any of these phases can increase LCP. That’s why you can have a lightweight WebP image and still experience poor LCP despite optimized images.
1. Slow Server Response Time (TTFB)
Before a browser can load your hero image, it must first receive the HTML document. If your server takes 1–2 seconds to respond, the browser cannot even begin discovering the LCP resource.
Google notes that Time to First Byte directly impacts all subsequent performance metrics, including LCP. A TTFB below 0.8 seconds is generally recommended.
Common causes
- Cheap shared hosting
- Unoptimized databases
- Excessive backend processing
- Poor caching
- No CDN
How to fix it
- Enable page caching
- Use a CDN
- Upgrade hosting infrastructure
- Optimize database queries
- Reduce server-side processing
2. Render-Blocking CSS
Even if your image downloads quickly, the browser may delay rendering until critical CSS is processed. This is one of the most overlooked LCP issues, not caused by images.
When large stylesheets block rendering, the browser waits before displaying visible content. Google’s performance guidance identifies render-blocking CSS as a common cause of LCP delays.
Fixes
- Inline critical CSS
- Remove unused CSS
- Minify stylesheets
- Defer non-critical CSS
3. JavaScript Is Blocking Rendering
Many websites focus on image optimization while ignoring JavaScript. In reality, JavaScript frequently becomes the biggest performance blocker.
Large JavaScript files can:
- Delay page rendering
- Block the main thread
- Prevent the LCP element from appearing
- Slow client-side rendering
Google specifically lists render-blocking JavaScript and client-side rendering as major LCP factors.
Typical offenders
- Analytics scripts
- Chat widgets
- A/B testing tools
- Tag managers
- Animation libraries
Fixes
- Add defer to non-critical scripts
- Remove unused JavaScript
- Delay third-party scripts
- Reduce framework overhead
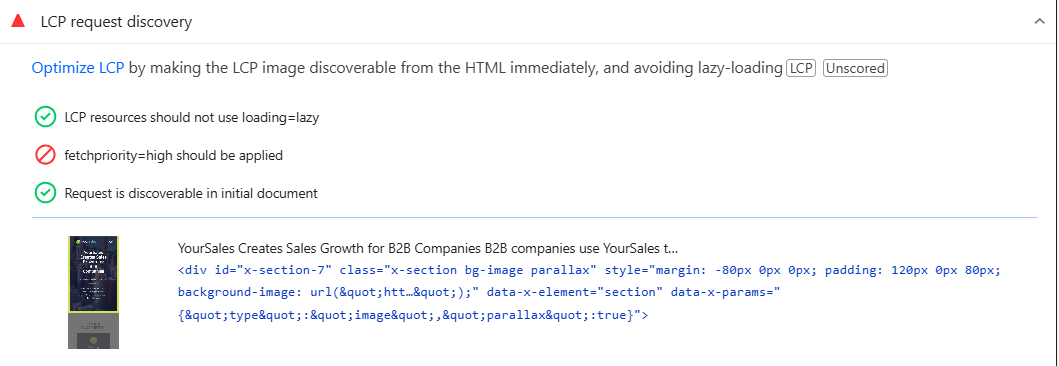
4. Your LCP Element Is Not Being Discovered Early
Many sites unintentionally hide their LCP image from the browser.
For example:
<div class="hero"></div>

.hero {
  background-image: url(hero.webp);
}
The browser must first download HTML, then CSS, and then discover the image. This creates a resource loading delay. Research shows that resource discovery delays often contribute more to poor LCP than image download time itself, especially on pages where images are already compressed and optimized.
Better approach
Use standard image elements:
<img src="hero.webp" alt="Hero Image">
Or preload critical assets:
<link rel="preload" as="image" href="hero.webp">
5. Client-Side Rendering Delays Content
Many modern websites rely heavily on React, Angular, Vue, and similar frameworks. When pages render entirely in the browser, users must wait for:
- HTML download
- JavaScript download
- JavaScript parsing
- JavaScript execution
- Content rendering
This creates significant render delays. Google specifically identifies client-side rendering as a common cause of slow LCP.
Possible solutions
- Server-side rendering (SSR)
- Static site generation (SSG)
- Partial hydration
- Hybrid rendering approaches
6. Web Fonts Are Delaying Rendering
Fonts can affect LCP more than many site owners realize. If a large heading becomes the LCP element, the browser may delay rendering until the font loads.
Fixes
- Use font-display: swap
- Preload critical fonts
- Reduce font variants
- Consider system fonts where appropriate
7. Third-Party Scripts Are Stealing Performance
Marketing tools often create hidden performance problems. Common examples include:
- Live chat widgets
- Tracking scripts
- Heatmaps
- Social embeds
- Consent banners
Even if your images are fully optimized, these third-party scripts can consume main-thread resources and delay rendering. A good rule is simple: If a script isn’t needed immediately, load it later.
8. You Accidentally Lazy Loaded the LCP Image
This is one of the most common LCP optimization mistakes. Many performance plugins automatically apply lazy loading to all images. If the LCP image is lazy-loaded, the browser intentionally delays fetching it.
Incorrect
<img src="hero.webp" loading="lazy">Correct
<img src="hero.webp" loading="eager">Or simply omit the lazy-loading attribute for above-the-fold images.
9. PageSpeed Insights and Real Users May Show Different Results
Another reason you may think the largest contentful paint is still high is that you’re comparing different datasets. PageSpeed Insights reports:
- Lab data (simulated testing)
- Field data (real users)
Field data includes slower devices, weaker networks, and real-world browsing conditions. Google notes that LCP measurements can also be affected by connection setup, redirects, and server delays before rendering even begins. This explains why image compression alone sometimes doesn’t immediately improve reported LCP scores.
10. Network Latency and Resource Delivery Delays
Sometimes, high LCP after optimizing images isn’t caused by the image or server itself, but by how quickly resources reach users. If your site lacks a CDN or has poor caching, the LCP element may load more slowly for visitors who are far from your server.
Common causes
- No Content Delivery Network (CDN)
- Poor CDN configuration
- Inefficient browser caching
- Long geographic distance between users and servers
- Slow delivery of critical assets
How to fix it
- Use a CDN to serve assets from locations closer to users
- Enable browser caching for static resources
- Cache critical assets at the edge
- Reduce unnecessary redirects
- Regularly test performance from multiple geographic locations
Even small delivery delays can keep Largest Contentful Paint still high, especially for websites serving visitors across multiple regions.
How to Identify What’s Actually Causing High LCP
Before applying more optimizations, it’s important to identify which element is being measured as LCP and where the delay is occurring. In many cases, the problem isn’t the image itself but a loophole somewhere in the loading or rendering process.
You can investigate and measure LCP using tools such as:
- PageSpeed Insights
- Chrome DevTools Performance Panel
- Lighthouse
- WebPageTest
- Google Search Console Core Web Vitals Report
For example, in PageSpeed Insights, scroll to the “Largest Contentful Paint element” diagnostic to see exactly which element is being measured and where the delay occurs.
These tools can reveal whether the delay is happening during server response, resource loading, or rendering. Pay close attention to the following patterns:
Once you know where the delay is occurring, you can focus on the specific issue instead of making random optimizations. This targeted approach is often the fastest way to reduce LCP further and improve overall page performance.
Conclusion
If you’re wondering why your LCP is still high after optimizing images, one of these 10 hidden causes is usually responsible. Image compression can reduce download time, but it won’t solve delays caused by slow servers, render-blocking CSS, JavaScript execution, client-side rendering, web fonts, or resource discovery issues.
In many cases, a high LCP after optimizing images is actually a sign that the cause lies elsewhere. By identifying whether the delay comes from server response times, resource discovery, JavaScript execution, or rendering, you can focus on the changes that will have the greatest impact on Core Web Vitals performance.