




TL;DR: Lab data and field data serve different purposes. Lab data helps identify and debug performance issues in a controlled environment, while field data shows how real users experience your website. For effective website speed optimization, use lab data to find and fix problems, then use field data to see whether those improvements are reflected in the real user experience and Core Web Vitals.
You’ve optimized your website, run a Lighthouse audit, and scored 95. Yet visitors still complain that pages feel slow, or your Core Web Vitals report continues to show poor performance.
If you’ve ever wondered why this happens, you’re looking at one of the biggest misconceptions in performance optimization: lab data vs field data.
Although both measure website performance, they answer different questions. Lab data shows how your site performs under a controlled test configuration, while field data reveals how it performs for real visitors using different devices, networks, and locations.
Understanding the difference can save hours of chasing the wrong metrics and help you focus on improvements that genuinely enhance user experience. More importantly, it helps you avoid optimizing for benchmark scores alone and instead focus on improvements that matter to both users and Google.
Lab Data vs Field Data: Which One Should You Choose?
You shouldn’t choose between lab data vs field data, you need both. Use lab data to identify and fix performance issues, then rely on field data to verify that real users are actually benefiting from those improvements.
| Lab Data | Field Data |
|---|---|
| Collected in a controlled, simulated environment | Collected from real users visiting your website |
| Helps identify and debug performance issues | Reflects the actual user experience |
| Available immediately after running a test | Collected over time from real user visits |
| Used by tools like Lighthouse and the lab section of PageSpeed Insights | Used by Chrome UX Report (CrUX), RUM tools, and the field data section of PageSpeed Insights |
| Best for development, testing, and debugging | Best for measuring real-user experience and Core Web Vitals |
| Shows how your site could perform | Shows how your site actually performs |
What Is Lab Data?
Lab data is website performance data collected in a controlled testing environment. Every test is performed under predefined conditions, allowing developers to reproduce results consistently.
Tools such as Lighthouse, GTmetrix, and WebPageTest generate lab data by loading your page on a simulated device with a predefined network speed and CPU configuration.
This makes lab data quite simple to explain:
It measures how your website performs under a controlled, repeatable set of conditions, not how every visitor experiences it. For example, when you run PageSpeed Insights, the Lighthouse section reports several lab performance metrics, including:
- Largest Contentful Paint (LCP)
- Interaction to Next Paint (INP)
- Cumulative Layout Shift (CLS)
- Total Blocking Time (TBT)
- Speed Index
These metrics are generated during a single test, meaning every run can produce slightly different values depending on server response times and network conditions.
Because the environment is controlled, PageSpeed Insights lab data is incredibly useful for debugging performance bottlenecks before deploying changes.
LCP, INP, and CLS are the current Core Web Vitals, while TBT and Speed Index are Lighthouse lab metrics that can help diagnose performance issues.
Advantages of Lab Data
Lab testing remains one of the most valuable tools for developers because it allows you to isolate problems quickly. Some of its biggest strengths include:
| Benefit | Why It Matters |
|---|---|
| Repeatable testing | Compare optimizations under identical conditions. |
| Immediate feedback | No need to wait for real user traffic. |
| Debugging friendly | Easily identify render-blocking resources, large JavaScript files, or oversized images. |
| Development testing | Validate changes before publishing them live. |
For example, if your homepage suddenly becomes slower after installing a marketing plugin, Lighthouse can immediately reveal whether the issue comes from JavaScript execution, unused CSS, or third-party scripts. This makes lab testing an essential part of every website performance optimization workflow.
What Is Field Data?
Field data measures website performance based on actual visits rather than simulated tests.
If your goal is to know how your website actually performs for visitors, field data is the metric you should trust. Unlike lab data, it reflects real user experiences and is the data Google uses to evaluate Core Web Vitals.
Every user accesses your site under different conditions, such as:
- Different smartphones
- Various desktop devices
- Slow and fast internet connections
- Different browsers
- Different countries
- Different server response times
Rather than simulating performance, field data captures these real experiences over time. This is why field data explained is often summarized as: It reflects what your users actually experience.
Unlike lab data, field data isn’t based on one test result. It represents a distribution of experiences from real users. When Core Web Vitals are reported as a single field value, Google uses the 75th percentile of those experiences to determine the metric’s performance level.
This matters because a page may perform very well for some visitors and poorly for others. The field-data result gives you a better picture of how the broader group of users is experiencing the page.
Google’s Chrome User Experience Report (CrUX) aggregates real-user performance data from eligible Chrome users. Unlike a simulated Lighthouse test, CrUX shows how users experience websites across different devices, networks, and real-world conditions.
Why Field Data Matters for Core Web Vitals and Search
When Google evaluates Core Web Vitals, it relies on real-user field data rather than a Lighthouse performance score. In tools such as PageSpeed Insights and Search Console, this field data comes from CrUX and is based on a rolling 28-day collection period when sufficient data is available.
Core Web Vitals are an important part of page experience, but they are only one part of Google’s overall Search systems. Passing Core Web Vitals does not guarantee higher rankings.
That’s why you may see this situation:
- Lighthouse Score: 97
- Chrome UX Report: Poor LCP
This doesn’t mean Lighthouse is wrong. It simply means your website performs well under one simulated scenario but not consistently for real users.
Perhaps visitors in rural areas experience slower server response times. Maybe mobile users download heavy third-party scripts . Or perhaps international visitors connect to servers much farther away. Only field data captures these real-world conditions.
This also explains why a website can receive an excellent performance score in tools like GTmetrix or Lighthouse but still feel slow to some visitors. Synthetic tests measure performance under controlled conditions, whereas field data reflects the variability of real devices, networks, and browsing environments. Looking at both datasets together provides a much more accurate picture of your website’s overall performance.
Lab Data vs Field Data: The Key Differences
Understanding lab data vs field data website performance becomes much easier when you compare them side by side.
| Factor | Lab Data | Field Data |
|---|---|---|
| Source | Simulated testing | Real user experiences |
| Environment | Controlled | Real-world |
| Data collection | Test runs on demand | Collected from user visits over time |
| Best for | Debugging and testing | Measuring actual user experience |
| Core Web Vitals assessment | Useful for diagnosis | Used for real-user assessment |
| Example tool | Lighthouse | Chrome UX Report |
A simple way to think about it is this:
- Lab data asks: “How fast can this page be?”
- Field data asks: “How fast is this page for real visitors?”
Both are valuable because they answer different questions.
Lighthouse vs Chrome UX Report
One of the most common comparisons is Lighthouse vs Chrome UX Report. Although both appear inside PageSpeed Insights, they measure performance differently.
Lighthouse
Lighthouse performs a fresh audit every time you run a test. It uses:
- Simulated mobile hardware
- Controlled CPU throttling
- Simulated network conditions
- One page load
This makes it ideal for identifying performance regressions immediately after code changes.
Chrome UX Report (CrUX)
The Chrome UX Report doesn’t simulate anything. Instead, it aggregates anonymous performance data from real Chrome users over approximately 28 days.
This means it reflects:
- Device diversity
- Geographic differences
- Real network quality
- Browser behavior
- Actual user interactions
Because CrUX represents genuine user experiences, it provides the field data used in Google’s Core Web Vitals reporting and assessment when sufficient data is available.
Why PageSpeed Insights Shows Both Lab and Field Data
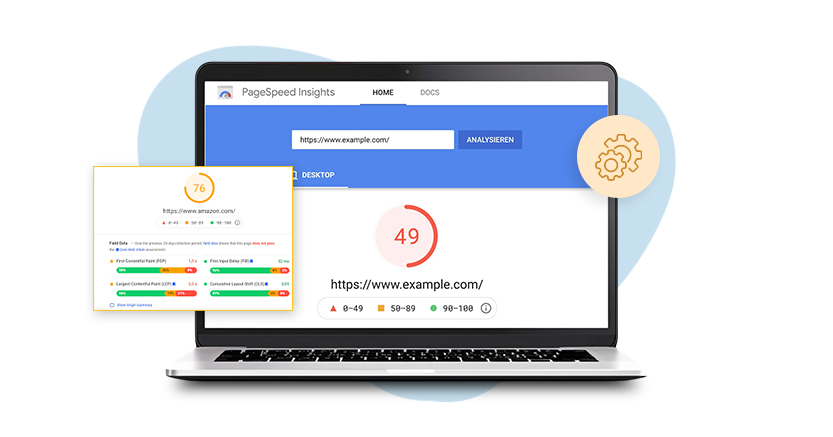
Many people assume PageSpeed Insights is just a Lighthouse tool, but that’s only half the story. PageSpeed Insights lab data comes directly from Lighthouse, giving you an instant snapshot of performance during a controlled test.
At the same time, PageSpeed Insights field data comes from the Chrome UX Report, showing aggregated real-user experiences from a rolling 28-day period.
This combination is intentional. Google wants you to answer two different questions:
- What problems exist right now? → Lab data
- Are real users actually experiencing those problems? → Field data
If your lab results improve but field data remains poor, don’t assume the optimization failed. CrUX uses a rolling 28-day window, so the field data can continue to reflect earlier user experiences. It can also reveal performance problems affecting specific devices, networks, locations, or other real-world conditions that your lab test doesn’t reproduce.
Real User Monitoring vs Lighthouse
A common debate in performance optimization is real user monitoring vs Lighthouse . The truth is that they complement each other rather than compete.
Lighthouse is a synthetic testing tool. It runs a page under predefined conditions and quickly highlights technical issues before or after deployment.
Real User Monitoring (RUM), on the other hand, continuously collects performance data from actual visitors. It shows how different devices, browsers, and network conditions affect the user experience.
| Lighthouse | Real User Monitoring (RUM) |
|---|---|
| Simulated testing | Real user data |
| Great for debugging | Great for monitoring live performance |
| Immediate results | Improves over time with more traffic |
| Used during development | Used after deployment |
For continued website performance optimization, use Lighthouse to identify issues and RUM or Chrome UX Report to confirm that real users benefit from your changes.
Which Website Performance Metrics Should You Trust?
When comparing field data vs lab data, neither is inherently better. The right choice depends on what you’re trying to achieve.
| Goal | Trust This Data |
|---|---|
| Debug performance issues | Lab data |
| Assess Core Web Vitals | Field data |
| Test new changes | Lab data |
| Measure actual user experience | Field data |
| Understand real-world device and network differences | Field data |
| Validate optimization work | Both |
If your Lighthouse score is low, use it to identify what’s slowing the page down. If your Core Web Vitals assessment is poor, focus on improving the experience reflected in field data. The best optimization decisions come from using both datasets together: lab data helps you find the problem, while field data shows whether the improvement actually benefits real users.
What If Lab Data and Field Data Don’t Match?
It’s common for lab and field data to tell different stories. For example, Lighthouse may report an LCP of 2.1 seconds, while Chrome UX Report shows 3.8 seconds. This usually happens because real users face conditions that a simulated test doesn’t capture, such as:
- Slow mobile devices
- High network latency
- Third-party scripts loading after the initial render
- Traffic from different geographic regions
- Server performance fluctuations
Also, remember that field data represents a distribution of real-user experiences, while a lab result is a single controlled test. The two numbers do not need to match to both be valid.
When results differ, investigate the root cause rather than assuming one metric is incorrect.
Best Workflow for Website Speed Optimization
A practical workflow looks like this:
- Run Lighthouse or PageSpeed Insights to identify performance issues.
- Fix issues like render-blocking CSS, oversized images, excessive JavaScript, or poor caching.
- Monitor Chrome UX Report field data or Real User Monitoring to verify improvements.
- Continue optimizing until both lab and field metrics improve.
This approach helps avoid optimizing solely for benchmark scores while ensuring real visitors see a faster website.
Common Mistakes to Avoid
Even experienced site owners often make these mistakes:
- Chasing a perfect Lighthouse score instead of improving real user experience.
- Ignoring field data because lab results look good.
- Testing only on desktop instead of mobile.
- Measuring performance only once after deployment.
- Assuming every performance issue affects SEO equally.
A balanced approach produces more reliable and sustainable improvements.
Conclusion
Understanding lab data vs field data helps you make smarter performance decisions instead of chasing a single score.
Lab data is your diagnostic tool. It helps uncover issues early and test optimizations in a controlled environment. Field data is your reality check, showing how your website performs for actual visitors and determining whether your Core Web Vitals meet Google’s standards.
The most effective website performance optimization strategy isn’t choosing one over the other, it’s using both together. Diagnose with lab data, validate with field data, and focus on improvements that make the experience faster for real users.
Frequently Asked Questions
Q1: Does Google use lab data or field data for Core Web Vitals?
Q2: Why is my Lighthouse score high but Core Web Vitals still failing?
Q3: Is PageSpeed Insights lab data accurate?
Q4: What is the difference between Chrome UX Report and Lighthouse?
Q5: Can I improve field data by fixing lab issues?
Q6: Which should I prioritize for website performance optimization?
About the Author