



TL;DR: Facebook Ads landing page view rate shows how many ad clicks turn into successfully loaded landing pages. A low rate can come from slow page speed, mobile performance issues, redirects, tracking problems, or users leaving before the page loads. Compare link clicks with landing page views, then test the destination page on real mobile conditions.
A Facebook ad can generate plenty of clicks and still send surprisingly few people to the page you actually want them to see.
That usually happens because a click isn’t the same as a loaded landing page. Someone can tap your ad, trigger a link click, and then leave before the destination finishes loading. Technical problems can create the same gap.
That is why the Facebook Ads landing page view rate deserves attention alongside CTR and CPC. It helps you understand what happens after someone clicks.
Why Do People Click Facebook Ads but Don’t Land?
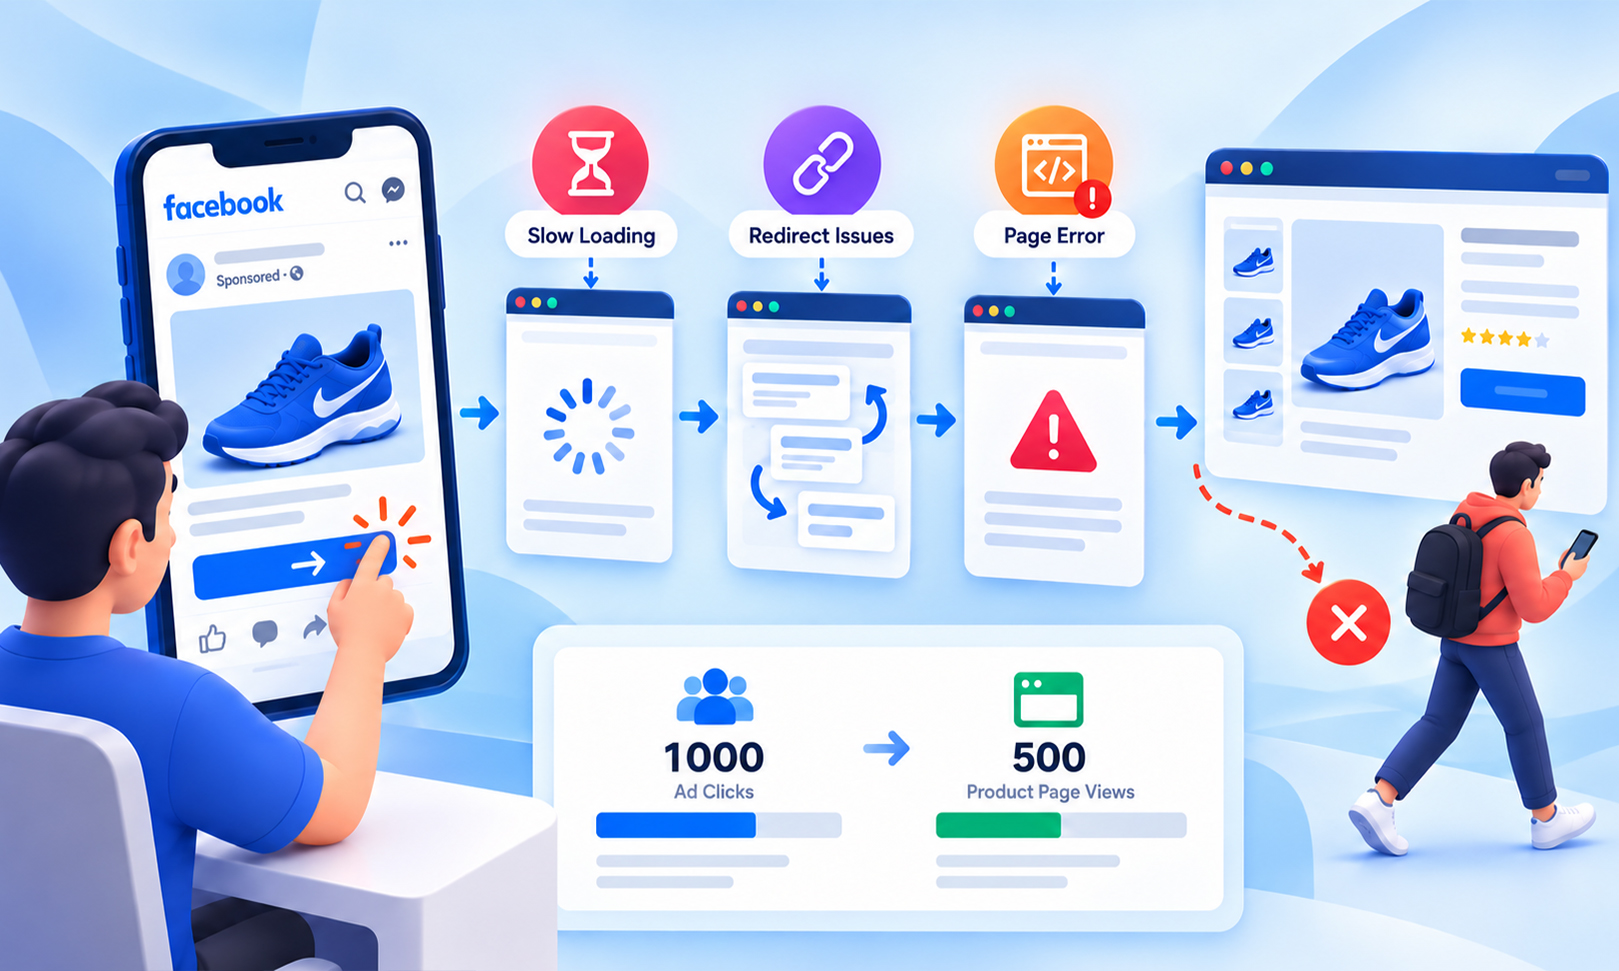
People may click a Facebook ad but never become a recorded landing page view if the destination loads slowly, fails, redirects, has tracking issues, or the visitor leaves before the page finishes loading.
| Reason | What happens |
|---|---|
| Slow landing page | The page takes too long to load, so visitors leave before it loads. |
| Mobile performance issues | Slow networks, large images, or heavy scripts delay the page on mobile. |
| Redirects or errors | Redirect chains, broken URLs, timeouts, or server errors prevent the page from loading properly. |
| Landing page errors | Server errors, broken URLs, timeouts, DNS issues, or incorrect redirects can prevent the destination page from loading. |
| Tracking problems | The visitor reaches the page, but the landing page view may not be recorded correctly. |
| Accidental or abandoned clicks | Some users leave immediately after clicking without waiting for the page to load. |
| What to check first | Compare link clicks vs. landing page views, then segment the data by device and placement and test the exact landing-page URL. |
In short: People can click a Facebook ad without becoming a recorded landing page view because the destination is slow, fails to load, requires redirects, has tracking issues, or the visitor leaves before the page finishes loading.
What Is Facebook Ads Landing Page View Rate?
Facebook Ads landing page view rate shows how many people who clicked an ad actually reached the landing page. Meta counts a landing page view when its tracking detects that the destination page was reached after the click.
A simple way to calculate it is:
Landing Page View Rate = (Landing Page Views ÷ Link Clicks) × 100
For example, suppose an ad receives:
- 1,000 link clicks
- 700 landing page views
The landing page view rate would be:
700 ÷ 1,000 × 100 = 70%
The important distinction is between the two measurements. A link click tells you that someone clicked the link. A landing page view represents a later stage in the journey, when Meta receives the relevant landing-page signal after the destination page begins loading.
This makes the metric useful for identifying losses between ad interaction → destination page.
It is also why comparing landing page views with “all clicks” can be misleading. Meta reports several click metrics, and they do not all represent the same action. For website traffic, use the relevant link or outbound click metric available in your reporting, then compare it with landing page views.
Why Do People Click Facebook Ads but Not Reach the Landing Page?
There isn’t one explanation for every campaign. The gap can come from both user behavior and technical problems.
1. The page takes too long to become usable
Page speed is one of the first things to check, but it should be considered alongside redirects, tracking, device performance, and user behavior.
If page speed turns out to be part of the problem, tools such as Website Speedy can help identify and address common performance issues without requiring you to manually optimize every technical detail.
A user clicks on your ad and expects the destination to appear immediately. If the browser spends several seconds downloading images, executing JavaScript, waiting for third-party services, or processing a large page, the user may leave before the page finishes loading.
Google has documented that slower pages can increase abandonment of navigation, and its current Core Web Vitals guidance focuses on loading performance, responsiveness, and visual stability as important aspects of user experience.
That doesn’t mean every low landing page view rate is caused by speed. It means speed is a credible technical variable that should be tested rather than guessed about.
2. Redirects add another step
Your ad might point to one URL while the final destination is another.
For example:
Ad URL → tracking URL → redirect → landing page
Each additional step can introduce latency or failure points. Redirects can also become problematic when a campaign URL, tracking parameter, domain configuration, or destination page has changed.
Check the complete redirect chain rather than testing only the final URL in isolation.
3. The destination page has an error
A broken link, server error, DNS issue, timeout, expired page, or incorrectly configured redirect can prevent a successful visit. This is particularly important when an ad campaign sends substantial paid traffic to a recently created landing page.
Don’t assume that because the URL works when you test it once, every visitor is experiencing the same thing.
4. Meta isn’t recording the landing page view
Tracking problems are a separate possibility. A visitor may reach the destination page, but if the relevant Meta tracking signal does not fire or is blocked, Ads Manager can record fewer landing page views than the actual number of page visits.
This is why you should compare Meta’s data with your analytics, server logs, or other first-party traffic data rather than treating one platform’s number as an exact count of human visits.
5. Some clicks are accidental or low-intent
Not every click represents a determined visitor. A person can tap an ad accidentally, change their mind immediately, or click without intending to wait for the destination to open. In those situations, the click can exist without a corresponding meaningful visit.
This is one reason landing page view rate should be interpreted alongside creative, placement, audience, and conversion data, not used as a standalone quality score.
Ad-to-page mismatch can create a similar pattern. Someone may click because the ad promises a specific offer, product, or outcome, then leave before the landing page view is recorded. Check that the ad’s message, offer, CTA, and destination page are closely aligned.
Is a 60% Landing Page View Rate Normal?
There is no universal percentage that can be called normal for every Facebook campaign.
A 60% landing page view rate means that roughly 60 out of every 100 relevant clicks became recorded landing page views. Whether that is acceptable depends on the campaign’s historical performance, audience, placements, device mix, destination page, tracking setup, and traffic conditions.
The more useful question is:
Has your landing page view rate changed, and can you explain why?
For example, imagine a campaign that historically produces an 85% rate and suddenly falls to 60%. That change deserves investigation.
But if two campaigns have different audiences, placements, devices, and destination pages, comparing their percentages without context can produce the wrong conclusion.
Treat the metric as a diagnostic signal rather than a universal pass/fail benchmark.
Can Slow Page Speed Cause a Low Landing Page View Rate?
Yes, it can. The mechanism is straightforward:
Ad click → browser starts navigation → page requests resources → browser processes them → page becomes usable → tracking registers
If the process is slow, there is more opportunity for the visitor to abandon it before the page becomes usable or the landing-page event is registered.
This is particularly relevant when the landing page contains large hero images, videos, multiple analytics tags, chat widgets, A/B-testing software, social embeds, or other third-party JavaScript.
Google recommends aiming for an LCP of 2.5 seconds or less, INP below 200 milliseconds, and CLS below 0.1 for a good Core Web Vitals experience. These aren’t Facebook Ads landing-page thresholds, but they provide useful performance targets for evaluating the destination experience.
If you are diagnosing speed problems, don’t rely exclusively on a desktop PageSpeed score. Real users can experience very different performance depending on their device, network, browser, and location.
A high PageSpeed score also doesn’t guarantee that every visitor experiences a fast page. Server response time, third-party scripts, caching, JavaScript execution, and network conditions can still affect real-world performance.
Can Mobile Performance Affect Facebook Landing Page Views?
Yes. Mobile performance can make the click-to-page journey more fragile.
Mobile visitors may be dealing with:
- Less powerful processors
- Variable cellular connections
- Higher network latency
- Limited memory
- Heavy JavaScript execution
- Large images or videos
- Multiple third-party tracking scripts
A page that feels fast on a high-end desktop can therefore behave very differently on a mid-range smartphone.
This is especially important for paid social campaigns because the landing page should be evaluated under the same conditions your audience actually uses, not just on the device used by the marketing team.
Google’s page-experience guidance also emphasizes that websites should provide a good experience across mobile devices, while Core Web Vitals measure real-world loading, responsiveness, and visual stability.
For practical mobile performance checks, test the actual ad destination rather than your homepage. This matters because landing pages often contain additional scripts, forms, promotional elements, and campaign-specific content.
How to Check Where Facebook Ad Clicks Are Being Lost
The easiest way to troubleshoot the problem is to work through the funnel instead of immediately changing the ad.
Step 1: Compare link clicks and landing page views
Start with the same date range, campaign, ad set, and ad.
Look for:
Link Clicks → Landing Page Views
Then calculate:
LPV Rate = LPVs ÷ Link Clicks × 100
A sudden change is often more informative than the absolute percentage.
Step 2: Break the data down by device
Compare mobile and desktop performance. If desktop produces a substantially higher landing page view rate while mobile produces a much lower one, investigate the mobile page before changing your creative.
Step 3: Check placements
Break performance down by Facebook and Instagram placements where the reporting allows it. A large difference between placements can help identify whether the issue is concentrated in a particular traffic source.
Step 4: Test the exact destination URL
Open the precise URL used in the ad.
Check:
- Redirects
- HTTPS
- Page errors
- Loading time
- Mobile layout
- Forms and buttons
- Images and videos
- Tracking scripts
- Meta Pixel/tracking implementation and whether the relevant page-load signal fires
- Third-party widgets
Don’t substitute the homepage for the campaign URL during testing.
Step 5: Use PageSpeed Insights and real-user data
Run the actual landing page through Google PageSpeed Insights and inspect both mobile and desktop results.
For deeper diagnosis, compare lab findings with field data where available. Comparing lab data vs. field data is also useful when a page performs well in a controlled test but feels slow to actual visitors.
Step 6: Inspect JavaScript and third-party scripts
Marketing pages commonly accumulate analytics, pixels, heatmaps, chat tools, personalization software, A/B-testing scripts, and other integrations. These can compete for browser resources and delay rendering or interaction.
If you’re investigating this, third-party scripts and website performance are worth examining, particularly when the landing page becomes slower after adding new marketing or tracking tools.
Tracking itself can also contribute to performance overhead. If your page becomes slower after adding multiple tracking tools, compare its performance before and after those changes instead of assuming the Facebook ad is responsible.
How to Improve Your Facebook Ads Landing Page View Rate
Improving the Facebook Ads landing page view rate starts with removing friction between the click and the loaded page.
Make the landing page load its important content firstPrioritize the content users need immediately. Avoid making the browser process unnecessary scripts and media before the main page becomes visible.
Large images are an obvious place to start. Responsive images, appropriate compression, and carefully applied lazy loading can reduce unnecessary initial work.
However, don’t blindly lazy-load the main above-the-fold image. The resource that contributes to LCP may need to be prioritized rather than deferred.
Reduce unnecessary JavaScript
Remove unused scripts and delay non-critical code, especially on landing pages that rely on multiple marketing integrations. Reducing JavaScript execution time can help the browser render and respond to the page sooner, particularly when large scripts are competing for resources.
Techniques such as removing unused JavaScript, splitting large bundles, and delaying non-critical scripts can help reduce this overhead.
Audit Meta and Other Tracking Scripts
Keep the measurement you actually need, but audit scripts periodically.
A Facebook Pixel, analytics platform, tag manager, chat widget, heatmap, personalization tool, and several other integrations can collectively create substantial browser work.
Improve mobile loading
Don’t optimize only for the desktop experience. Check image sizes, JavaScript execution, layout stability, fonts, third-party resources, and server response on mobile.
Keep redirects and destinations simple
Whenever practical, send the ad directly to the intended landing page. If redirects are necessary for tracking or other reasons, make sure they resolve reliably and quickly.
Monitor the rate after every major change
Once you’ve fixed a suspected issue, don’t rely only on a speed score. Compare the same campaign’s:
Link clicks → Landing page views → Landing-page engagement → Conversion
before and after the change. That gives you a much clearer picture of whether the technical improvement actually affected the paid-traffic journey.
Example: Diagnosing a Low Landing Page View Rate
Imagine an ecommerce campaign produces:
| Metric | Before optimization | After optimization |
|---|---|---|
| Link clicks | 2,000 | 2,000 |
| Landing page views | 1,200 | 1,600 |
| LPV rate | 60% | 80% |
| Ad CTR | 2.8% | 2.8% |
The important point is that the ad’s ability to generate clicks hasn’t changed. The difference appears after the click.
If the landing page was made faster and the tracking setup remained consistent, the improvement in recorded landing page views provides useful evidence that the destination experience was contributing to the original gap.
It still doesn’t prove that page speed was the only cause. Good diagnosis requires checking redirects, tracking, placement, device, and user behavior as well.
Conclusion
A high number of Facebook ad clicks doesn’t necessarily mean that an equally high number of people reached your landing page.
The Facebook Ads landing page view rate helps expose what happens between those two points. When the rate falls, investigate the complete journey: page speed, mobile performance, redirects, tracking, placements, and user behavior.
The most useful approach is not to chase a universal benchmark. Compare your own data, identify where the drop occurs, test the exact landing page under realistic conditions, and measure whether the change improves the click-to-page journey.
Frequently Asked Questions
What is a good Facebook Ads landing page view rate?
Why are my Facebook link clicks high but landing page views low?
Is a 60% landing page view rate bad?
Does page speed affect Facebook Ads performance?
How can I check if mobile speed is causing lost Facebook ad clicks?
Should I optimize for link clicks or landing page views?
About the Author