



TL;DR: A waterfall chart lists every file a page loads, in order, with a timing bar for each one. It reveals where page load time actually goes: slow server responses, render-blocking CSS and JavaScript, long request chains, and third-party scripts. Fixing the longest bars and the earliest blockers usually produces the biggest speed gains.
A PageSpeed score says a page is slow. It does not say why. A page can score 40 because the server takes two seconds to respond, because a font file blocks rendering, or because a chat widget pulls in thirty extra files. Each problem has a different fix, and a score cannot tell them apart.
A request waterfall chart can. It shows every network request the browser makes while loading a page, when each one starts, how long it takes, and what triggered it. This guide explains how to read each timing phase, which patterns point to real performance problems, which tools produce the most useful charts, and how the results tie back to Core Web Vitals.
What Is a Request Waterfall Chart?
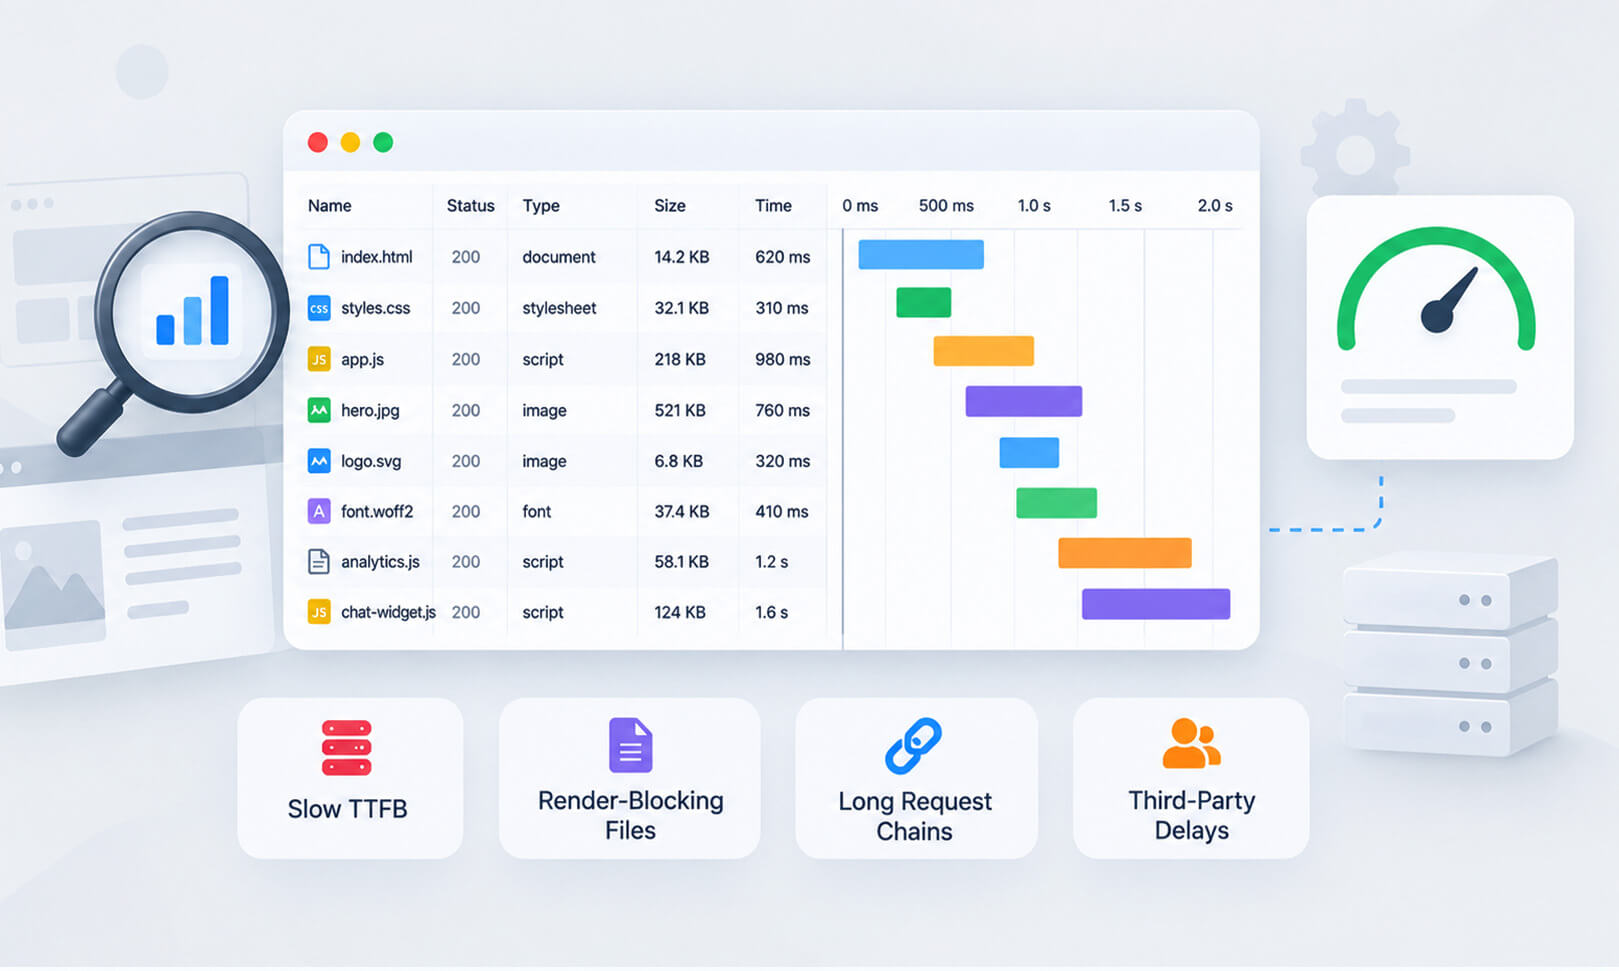
A request waterfall chart is a visual timeline of the network requests a web page makes while loading. It shows resources such as HTML, CSS, JavaScript, images, fonts, and third-party files, along with when each request starts and how long it takes. Each request appears as a horizontal bar, stacked top to bottom in the order the browser started them. The staggered layout resembles a waterfall, hence the name.
The chart answers four questions for every file: what was requested, when it started, how long each phase took, and what caused it to load. Together, those answers explain page load time better than any single metric.
| What the chart shows | Why it matters |
|---|---|
| Total number of network requests | More requests mean more overhead, especially on mobile connections |
| Start time of each request | Reveals what the browser had to wait for before requesting each file |
| Timing phases within each bar | Separates server delays from download delays from queueing |
| Request initiator | Shows which file triggered another, exposing hidden dependencies |
| Vertical event lines | Mark milestones such as First Paint, DOMContentLoaded, and Load |
How to Read a Waterfall Chart
Learning how to read a waterfall chart comes down to three skills: understanding the phases inside a single bar, following the order of requests down the page, and tracing which request caused which.
The Timing Phases Inside Each Request
Every bar in a network request waterfall is split into color-coded segments. The exact colors vary by tool, but the phases are consistent.
DNS Lookup
Before the browser can fetch anything from a domain, it needs that domain’s IP address. A DNS lookup happens once per domain, so a page pulling files from twelve different domains pays this cost twelve times.
Connection and SSL
Next, the browser establishes or reuses a connection to the server. For HTTPS requests, a new connection can also require a TLS handshake. When a new connection is needed, this setup adds latency before the resource can be transferred.
TTFB (Time to First Byte)
TTFB is the time between the start of a request and the browser receiving the first byte of the response. On the main HTML document, a high Time to First Byte can point to slow server processing, ineffective caching, database work, redirects, or network latency. Because the HTML document is often responsible for discovering other resources, a high TTFB can delay requests that come after it.
Content Download
The final segment is the actual transfer of bytes. A long download phase on an image or JavaScript bundle points to file size. Compression, modern image formats, and code splitting fix it.
Request Order and the Request Chain
The vertical order of bars shows how the browser discovered each file. The HTML comes first, then CSS and JavaScript from the head, followed by fonts and images found while parsing.
The pattern to watch is the request chain. When one resource has to be discovered or completed before another request can begin, the dependency can delay the next resource. Long chains can push important resources later in the loading process, even when the individual files are small.
Following the Request Initiator
Most tools show a request initiator column naming the file that triggered each request. A twelve-file cluster from an unfamiliar domain is often traced back to a single tag manager script, which becomes the real target for cleanup.
What a Waterfall Chart Reveals About Speed Problems
A website performance waterfall is most useful when specific shapes are matched to specific causes. These five patterns cover the majority of slow pages.
A Long Bar at the Top
If the HTML document has a wide TTFB segment, nothing else can begin until it arrives. This is a server problem: missing page caching, slow hosting, or an application doing too much work per request. Optimizing images will not help until this bar shrinks.
A Stack of Requests Before the First Paint Line
When critical CSS or JavaScript appears early in the waterfall and delays the browser from rendering important content, those resources deserve closer attention. Non-critical JavaScript can often be deferred or loaded asynchronously, while critical CSS can be optimized so the browser can render the initial view sooner. Deferring non-critical scripts and inlining critical CSS pulls the paint line left.
Clusters From Outside Domains
Third-party scripts for analytics, chat, reviews, and ads show up as groups of requests from domains the site does not control. Each group pays its own DNS and connection cost, and response times depend on someone else’s servers. Sorting by domain shows how much of the page load time belongs to outside services.
Staircase Patterns
A staircase, where each request starts only after the previous one ends, signals a dependency chain. Common causes include CSS @import statements, scripts that inject other scripts, and fonts declared inside CSS rather than preloaded in the HTML. Preload hints let the browser fetch these files in parallel.
Gaps and Idle Time
A large gap between requests means the browser is not actively transferring a resource during that period. The cause could be JavaScript execution, resource discovery, request dependencies, browser scheduling, or other work happening on the main thread. The waterfall alone cannot tell you exactly what caused the gap, so use the browser’s Performance panel when you need to investigate JavaScript execution or responsiveness problems.
Which Tools Show a Request Waterfall Chart?
Several tools generate a network waterfall chart, and each suits a different stage of diagnosis. Chrome DevTools is the fastest option for live debugging, while GTmetrix is better for sharing results and testing from different locations.
How to Run a Waterfall Analysis Step by Step
A repeatable waterfall analysis keeps the focus on the biggest delays rather than the most visible ones.
1. Test under realistic conditions. Use a mobile profile with throttled CPU and a 4G connection. A fast desktop on fiber hides most problems real visitors experience.
2. Run the test at least three times. Third-party response times vary, and a single run can make a temporary hiccup look like a chronic problem.
3. Check the HTML document’s TTFB first. If it is slow, fix the server before touching anything else.
4. Find the first paint marker. Every request that finishes before it is a candidate for deferral, async loading, or removal.
5. Sort by duration and by size. The longest bars and the heaviest files are the highest-value targets.
6. Group requests by domain. Separate first-party files from third-party scripts and question whether each outside service is worth its cost.
7. Trace long chains back to their initiator. Flatten dependencies with preload hints or by moving critical resources into the HTML.
8. Re-test after each change. A before-and-after chart confirms the fix worked and shows the next bottleneck.
Tools such as Website Speedy handle several of these fixes automatically, including deferring render-blocking JavaScript and delaying non-critical third-party scripts, without manual code changes.
How Waterfall Findings Connect to Core Web Vitals and SEO
Every Core Web Vitals metric has a footprint in the waterfall. Largest Contentful Paint depends on how early the hero image is requested and how long its bar runs. A hero image that starts late because it was referenced in CSS instead of the HTML is one of the most common LCP problems.
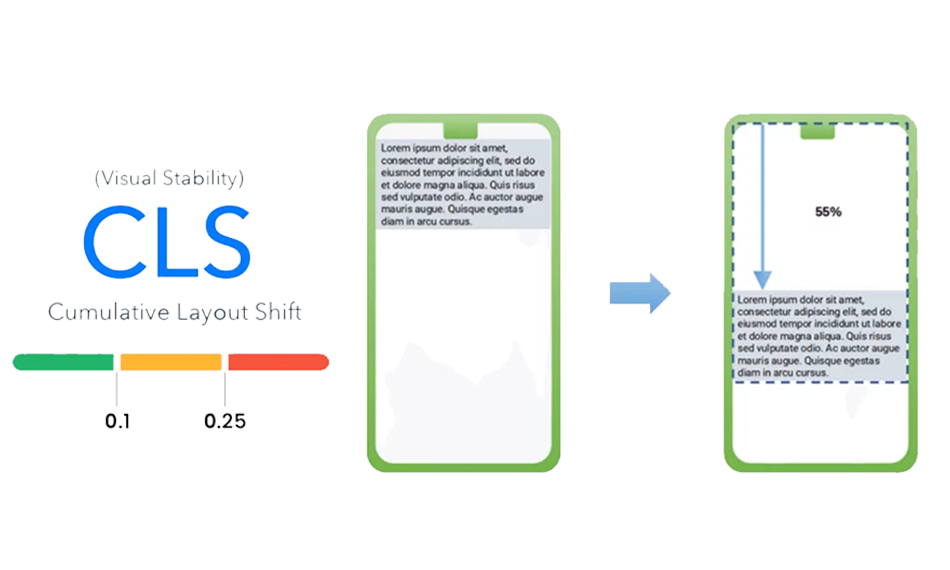
Interaction to Next Paint suffers from the idle gaps caused by heavy JavaScript. Cumulative Layout Shift often traces back to fonts and images that arrive after the page has been painted.
Speed also affects how search engines process a site. Faster server responses let Googlebot crawl more pages per visit, which supports timely indexing on large sites. Structured data can earn rich snippets that improve CTR, but those results only help if the page loads fast enough to keep the click.
Conclusion
A speed score points at a problem. The waterfall points at the cause. Reading the phases inside each bar separates server delays from download delays, following the request chain exposes hidden dependencies, and grouping by domain shows how much of the page belongs to outside services.
Fix the longest bar at the top first, defer anything the page does not need immediately, and re-test after every change. Most slow pages come down to a handful of requests, and the waterfall makes them impossible to miss.
Frequently Asked Questions
What does a waterfall chart show in website testing?
What is a good number of requests for a web page?
Why is the first request in the waterfall so long?
What do the colors in a waterfall chart mean?
About the Author