


TL;DR: In 2026, website performance metrics go beyond simple load time. Core Web Vitals, server response speed, mobile performance, and user engagement signals together determine how fast and reliable your site feels. Tracking and improving these metrics helps boost SEO rankings, enhance user experience, and increase conversions.
The success of a website is no longer defined solely by content quality or SEO tags. It’s deeply grounded in actual user experience. The right website performance metrics tell you how fast your site feels, how stable it is, and how responsive it appears to real users. These aren’t vanity numbers, they directly influence search rankings, user engagement, and conversion rates.
This article breaks down the essential metrics to measure website performance, explains why they matter for SEO and UX, and offers actionable insights and benchmarks you can apply right away.
Understanding Website Performance Metrics
Website performance metrics are quantifiable data points that reveal how quickly and smoothly your website functions for visitors. They measure loading speed, responsiveness, visual stability, and overall usability from a real-user perspective. Instead of relying on guesswork, these metrics provide concrete insights into where your site may be slowing down and what needs optimization.
Today, the most influential signals fall under Google’s Core Web Vitals framework. However, comprehensive performance analysis goes beyond those three metrics. It also includes factors like server response time, rendering efficiency, interaction latency, and layout shifts, all of which shape user experience, search rankings, and conversion performance.
Why Performance Metrics Matter in 2026?
Performance is no longer a backend technical concern, it’s a visibility, experience, and revenue driver. Both search engines and users expect websites to load quickly, respond instantly, and remain stable during interaction. Here’s why tracking the right website performance metrics is critical:
SEO Impact
Google evaluates page experience using Core Web Vitals alongside traditional ranking signals such as content relevance and backlinks. When your site consistently meets performance benchmarks for LCP, INP, and CLS, it sends strong quality signals about usability and technical health.
Faster, more stable websites are easier for search engines to crawl and index efficiently, which can positively influence visibility across both mobile and desktop results. While performance alone won’t outrank great content, poor performance can absolutely hold strong content back.
User Experience
Users make split-second judgments. If a page feels slow or visually unstable, trust drops immediately. Delays in loading key content or lag in button clicks create friction, and that increases abandonment.
On the other hand, fast and responsive sites feel professional, reliable, and easier to use. Smooth scrolling, instant interactions, and stable layouts improve engagement, increase time on site, and encourage users to explore additional pages.
Business Outcomes
Performance directly affects revenue. Even small delays, measured in milliseconds, can reduce conversion rates, especially in competitive industries like e-commerce and SaaS. Faster websites typically see lower cart abandonment, higher form completion rates, and improved customer satisfaction.
Performance improvements also enhance ad visibility, campaign ROI, and retention metrics. In other words, speed optimization is not just technical fine-tuning; it is a growth strategy.
2026 Benchmarks You Can Use Today
If you want your website performance metrics to translate into real SEO and UX gains, you need clear, measurable targets. The following website performance benchmarks reflect current Google guidance, industry studies, and real-world performance data trends heading into 2026. Use them as practical performance goals, not vanity numbers, but thresholds that directly influence rankings, engagement, and conversions.
Below is an expanded benchmark table with additional critical web performance metrics you should track:
| Metric | Target (2026) | Why It Matters |
|---|---|---|
| LCP (Largest Contentful Paint) | ≤ 2.5s | Ensures the main content loads quickly, directly impacting Core Web Vitals and perceived speed. |
| INP (Interaction to Next Paint) | ≤ 200ms | Measures responsiveness; lower values mean smoother user interactions and better UX. |
| CLS (Cumulative Layout Shift) | < 0.1 | Prevents visual instability that frustrates users and harms trust. |
| TTFB (Time to First Byte) | ≤ 800ms | Reflects server responsiveness; faster TTFB improves overall page load chain. |
| FCP (First Contentful Paint) | ≤ 1.8s | Shows users something meaningful quickly, reducing perceived wait time. |
| Speed Index | ≤ 3.4s | Indicates how fast visible content is rendered during load. |
| Total Page Weight | < 1.5 MB | Lighter pages load faster, especially on mobile networks. |
| TBT (Total Blocking Time) | ≤ 200ms | Reduces main-thread blocking, improving interactivity and Lighthouse performance scores. |
| Number of HTTP Requests | < 50 – 75 | Fewer requests reduce latency and improve loading efficiency. |
| Mobile Load Time | ≤ 3s | Critical for mobile-first indexing and reducing abandonment rates. |
| DNS Lookup Time | ≤ 100ms | Faster DNS resolution shortens connection setup time. |
| Error Rate | < 1% | High reliability maintains user trust and crawl efficiency. |
| Cache Hit Ratio | ≥ 80% | Strong caching reduces server load and speeds up repeat visits. |
17 Most Important Website Performance Metrics in 2026 Explained
Understanding website performance metrics in 2026 requires looking beyond a single speed score. Modern performance measurement combines loading efficiency, server responsiveness, network behavior, and user engagement signals. Below are the 17 most important metrics to measure website performance effectively, along with practical guidance to improve each one.
1. Core Web Vitals
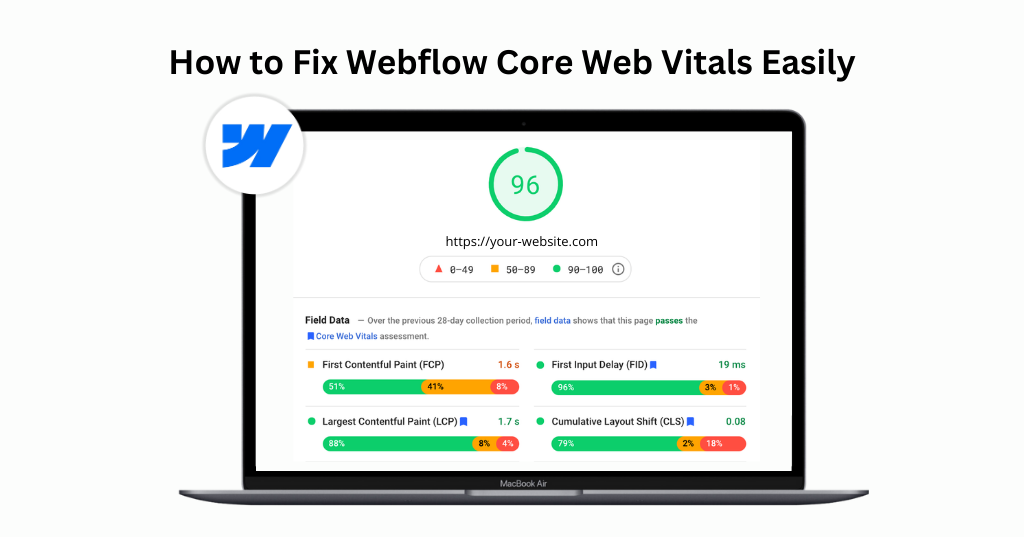
Core Web Vitals are a set of standardized web performance metrics defined by Google to measure real user experience. They include Largest Contentful Paint (loading performance), Interaction to Next Paint (interactivity), and Cumulative Layout Shift (visual stability). These metrics are based on real-world user data and reflect how a page actually behaves during loading and interaction, rather than just how it performs in a lab test.
Why It Matters
Core Web Vitals directly influence search rankings and strongly impact user satisfaction. Pages that load quickly, respond instantly, and remain visually stable are more likely to retain users, reduce bounce rates, and improve conversion performance.
How to Improve Core Web Vitals
Improving Core Web Vitals requires addressing both frontend and backend bottlenecks.
- Optimize your largest above-the-fold images using next-generation formats and preload critical resources to improve LCP.
- Reduce long JavaScript tasks and break large scripts into smaller chunks to enhance INP.
- Always define fixed dimensions for images, ads, and embeds to prevent layout shifts that negatively affect CLS.
- Using a global CDN can further reduce latency and improve real-user performance across geographic regions.
2. Page Load Metrics
Page load metrics measure how quickly visible content appears and when the page becomes usable. This includes metrics like First Contentful Paint (FCP), Largest Contentful Paint (LCP), and fully loaded time. These page performance metrics provide insight into how long users wait before seeing meaningful content and interacting with your site.
Why It Matters
Users form impressions within seconds. If your page appears blank or partially rendered for too long, users may abandon it before engaging with your content or offers.
How to Improve Page Load Metrics
To improve page load metrics:
- Prioritize optimizing the critical rendering path.
- Minify and compress CSS and JavaScript files to reduce transfer size. Defer non-essential scripts so they do not block rendering.
- Implement lazy loading for images and videos that are below the fold.
- Enable modern protocols like HTTP/2 or HTTP/3 to improve resource delivery efficiency.
3. Website Speed (Overall Load Time)
Website speed refers to the total time it takes for a webpage to load and become fully interactive. It is influenced by server response time, network conditions, file sizes, and browser rendering behavior. While it’s a broad term, it encompasses multiple website speed metrics working together.
Why It Matters
Even small delays in website speed can reduce user trust, increase abandonment, and lower conversions. Faster websites also enable more efficient search engine crawling and indexing.
How to Improve Website Speed
Start by upgrading to reliable, high-performance hosting that provides low latency and consistent uptime. Implement browser caching to reduce repeat load times for returning users. Use a content delivery network (CDN) to serve static assets from edge locations closer to users. Regularly audit and remove unnecessary plugins, scripts, or large media files that add weight to your pages.
4. Performance Score
The performance score is a lab-based evaluation generated by tools such as Lighthouse and PageSpeed Insights. It aggregates multiple performance indicators, including LCP, TBT, and CLS, into a single score between 0 and 100 to provide a simplified health overview of your site’s speed performance.
Why It Matters
Although it is not a direct ranking factor, this score helps identify technical issues that may affect real user experience and SEO performance.
How to Improve Performance Score
To improve your performance score:
- Carefully analyze the diagnostic suggestions provided by Lighthouse. Eliminate render-blocking resources by deferring non-critical CSS and JavaScript.
- Remove unused code and reduce heavy third-party scripts.
- Optimize web fonts by using font-display strategies and limiting unnecessary font weights or families.
5. Mobile Load Time
Mobile load time measures how quickly your website loads and becomes interactive on mobile devices using real-world network conditions. Because mobile devices often have slower processors and variable network speeds, performance on mobile devices can differ significantly from that on desktops.
Why It Matters
Since the majority of global traffic comes from mobile devices, poor mobile load time directly affects engagement, conversions, and search rankings under mobile-first indexing
How to Improve Mobile Load Time
To improve mobile load time, you need to keep these things in mind while making your site:
- Design with a mobile-first mindset.
- Compress and resize images specifically for smaller screens rather than relying on desktop versions.
- Avoid autoplay videos and heavy animations that strain mobile CPUs. Minimize the DOM size and reduce unnecessary JavaScript execution to ensure smoother mobile performance.
6. Bounce Rate
Bounce rate measures the percentage of users who leave a site after viewing only one page without further interaction.
Why It Matters
Slow-loading pages and poor responsiveness often correlate with higher bounce rates and lost opportunities.
How to Improve It
- Improve page speed and visual stability.
- Ensure above-the-fold content clearly communicates value.
- Reduce intrusive pop-ups that interrupt user experience.
7. Number of HTTP Requests
This metric counts how many separate network requests are required to load a webpage, including images, scripts, fonts, and stylesheets. Each request introduces additional latency and processing overhead.
Why It Matters
A high number of HTTP requests increases load times and network congestion, particularly on slower connections.
How to Improve It
- Consolidate CSS and JavaScript files when appropriate.
- Remove unused assets and plugins that generate unnecessary requests.
- Use CSS sprites or inline SVGs where practical to reduce multiple small image requests.
- Limit third-party integrations.
8. TBT (Total Blocking Time)
Total Blocking Time measures how long the browser’s main thread is blocked by long-running JavaScript tasks during page load. When the main thread is busy, the browser cannot respond to user interactions promptly.
Why It Matters
High TBT creates a laggy experience where buttons feel unresponsive and scrolling stutters, leading to frustration and decreased trust.
How to Improve TBT
Reduce the size of JavaScript bundles by implementing code splitting and tree shaking. Defer non-essential scripts, so they load after the main content. Remove outdated plugins and evaluate third-party tools that may be executing heavy scripts unnecessarily.
9. TTFB (Time to First Byte)
Time to First Byte measures the duration between a browser requesting a page and receiving the first byte of data from the server. It reflects backend efficiency, hosting quality, and server configuration.
Why It Matters
A slow TTFB delays all subsequent loading events, negatively impacting LCP and overall page responsiveness.
How to Improve TTFB
- Choose optimized hosting infrastructure with fast server processing times.
- Enable server-side caching so frequently requested pages are delivered quickly.
- Optimize database queries and remove unnecessary backend processing that increases response time.
10. DNS Lookups
DNS lookup time measures how long it takes for a browser to resolve a domain name into an IP address before establishing a connection to the server.
Why It Matters
Multiple third-party services increase DNS lookups, adding latency before content even begins loading.
How to Improve It
- Limit the number of external domains your website depends on. Consolidate analytics and marketing tools when possible.
- Use DNS prefetching for critical third-party resources to speed up domain resolution.
- Combine CSS and JS files where possible.
- Remove unused plugins.
11. Total Page Size
Total page size refers to the combined weight of all files needed to load a webpage, including HTML, CSS, JavaScript, images, fonts, and media assets.
Why It Matters
Heavier pages require more bandwidth and time to load, particularly on mobile networks or slower connections.
How to Improve It
- Compress images using modern formats like WebP or AVIF.
- Remove unused JavaScript libraries.
- Enable gzip or Brotli compression on your server.
- Avoid embedding large media files unless necessary for the user experience.
- Use modern image formats.
12. User Patience Index
The User Patience Index represents the average threshold at which users abandon a page due to slow loading. While not a formal analytics metric, it reflects behavioral expectations around performance.
Why It Matters
Users expect websites to load within a few seconds. Delays beyond that window significantly increase abandonment rates.
How to Improve It
- Prioritize loading critical above-the-fold content first.
- Use skeleton screens or progress indicators to improve perceived speed.
- Ensure your server and CDN deliver content quickly under peak traffic conditions.
13. Cache Hit Ratio
Cache hit ratio measures how often requested content is served from cache rather than being regenerated or fetched from the origin server.
Why It Matters
Higher cache efficiency reduces server strain and significantly improves loading speed for repeat visitors.
How to Improve It
- Configure browser caching with appropriate cache-control headers.
- Use CDN edge caching for static assets.
- Implement object caching for database-heavy applications.
14. Average Session Duration
Average session duration tracks how long users stay engaged on your website during a visit.
Why It Matters
Improved performance often correlates with increased engagement and deeper content consumption.
How to Improve It
- Enhance navigation responsiveness.
- Improve internal linking to guide users naturally through related content.
- Ensure interactions such as filtering, searching, or scrolling feel smooth and responsive.
15. Pages per Session
Pages per session measures how many pages users visit during a single session, indicating engagement depth.
Why It Matters
A fast, frictionless experience encourages users to explore more pages and increases potential conversions.
How to Improve It
- Optimize internal linking structures.
- Improve page transition speed.
- Use preloading techniques to load the likely next pages faster.
- Optimize navigation menus.
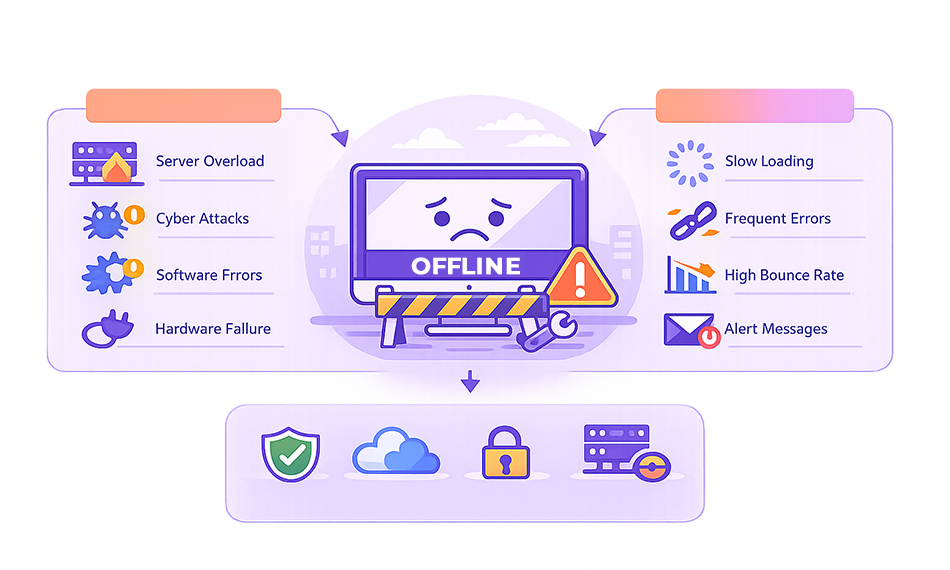
16. Error Rate
Error rate measures how frequently server errors, broken scripts, or failed requests occur during user sessions.
Why It Matters
Frequent errors damage trust, harm SEO crawlability, and disrupt user experience.
How to Improve It
- Monitor server logs and uptime consistently.
- Fix broken links and test third-party integrations regularly.
- Implement automated monitoring alerts to detect failures early.
17. Scroll Depth
Scroll depth tracks how far users move down a webpage, indicating content engagement and interest.
Why It Matters
If users abandon pages early due to slow loading or layout instability, scroll depth decreases significantly.
How to Improve It
- Optimize above-the-fold loading performance.
- Reduce layout shifts that disrupt reading flow.
- Structure content clearly with headings, visuals, and engaging formatting.
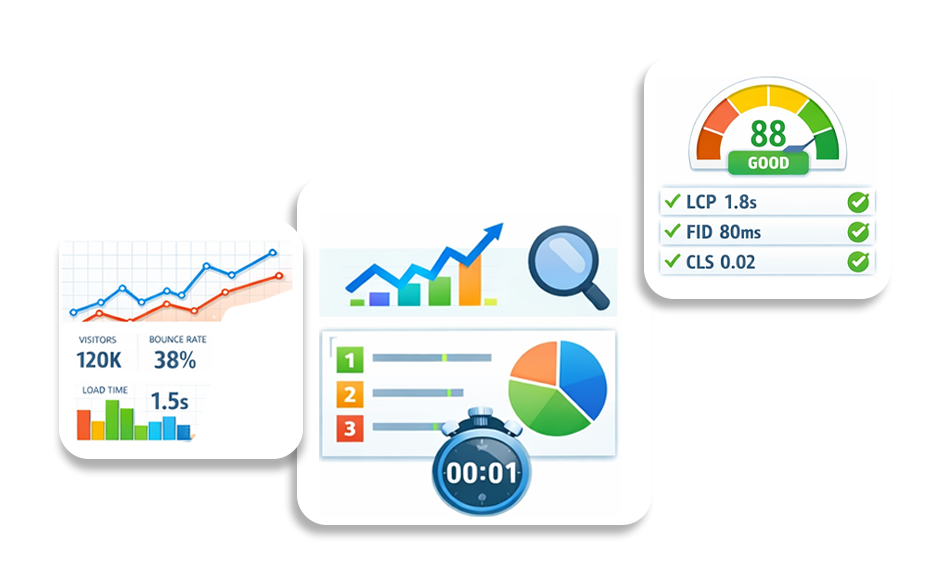
How to Measure Website Performance Accurately (Best Tools)
To measure website performance accurately, combine lab testing tools with real-user data so you can analyze both controlled test results and real-world visitor experiences. This approach ensures your website performance metrics reflect actual speed, interactivity, and stability across devices and networks.
Website Speedy:
A performance monitoring and optimization-focused tool, Website Speedy helps track website speed metrics, identify bottlenecks, and monitor improvements over time with actionable insights.
Google PageSpeed Insights
Provides both lab and Chrome User Experience Report (CrUX) field data. Google PageSpeed Insights highlights Core Web Vitals, performance opportunities, and diagnostics directly from Google’s ecosystem.
Lighthouse
An open-source auditing tool built into Chrome DevTools. It analyzes performance, SEO, accessibility, and best practices under controlled conditions.
WebPageTest
Offers advanced performance diagnostics, including waterfall charts, filmstrip views, Core Web Vitals breakdowns, and multi-location testing for deeper technical analysis.
Real User Monitoring (RUM):
Collects performance data from actual visitors across devices, browsers, and networks, giving you real-world insights into how users truly experience your site.
Conclusion
In 2026, website performance metrics aren’t optional, they’re strategic essentials. From Core Web Vitals that shape SEO outcomes to supporting metrics that reveal hidden performance bottlenecks, understanding and optimizing these numbers should be part of every digital strategy.
Performance isn’t just technical jargon. It has a measurable impact on rankings, engagement, and business results. When you align your metrics with real-world benchmarks and user experience goals, you’re building a website that feels fast and performs reliably in every context.