



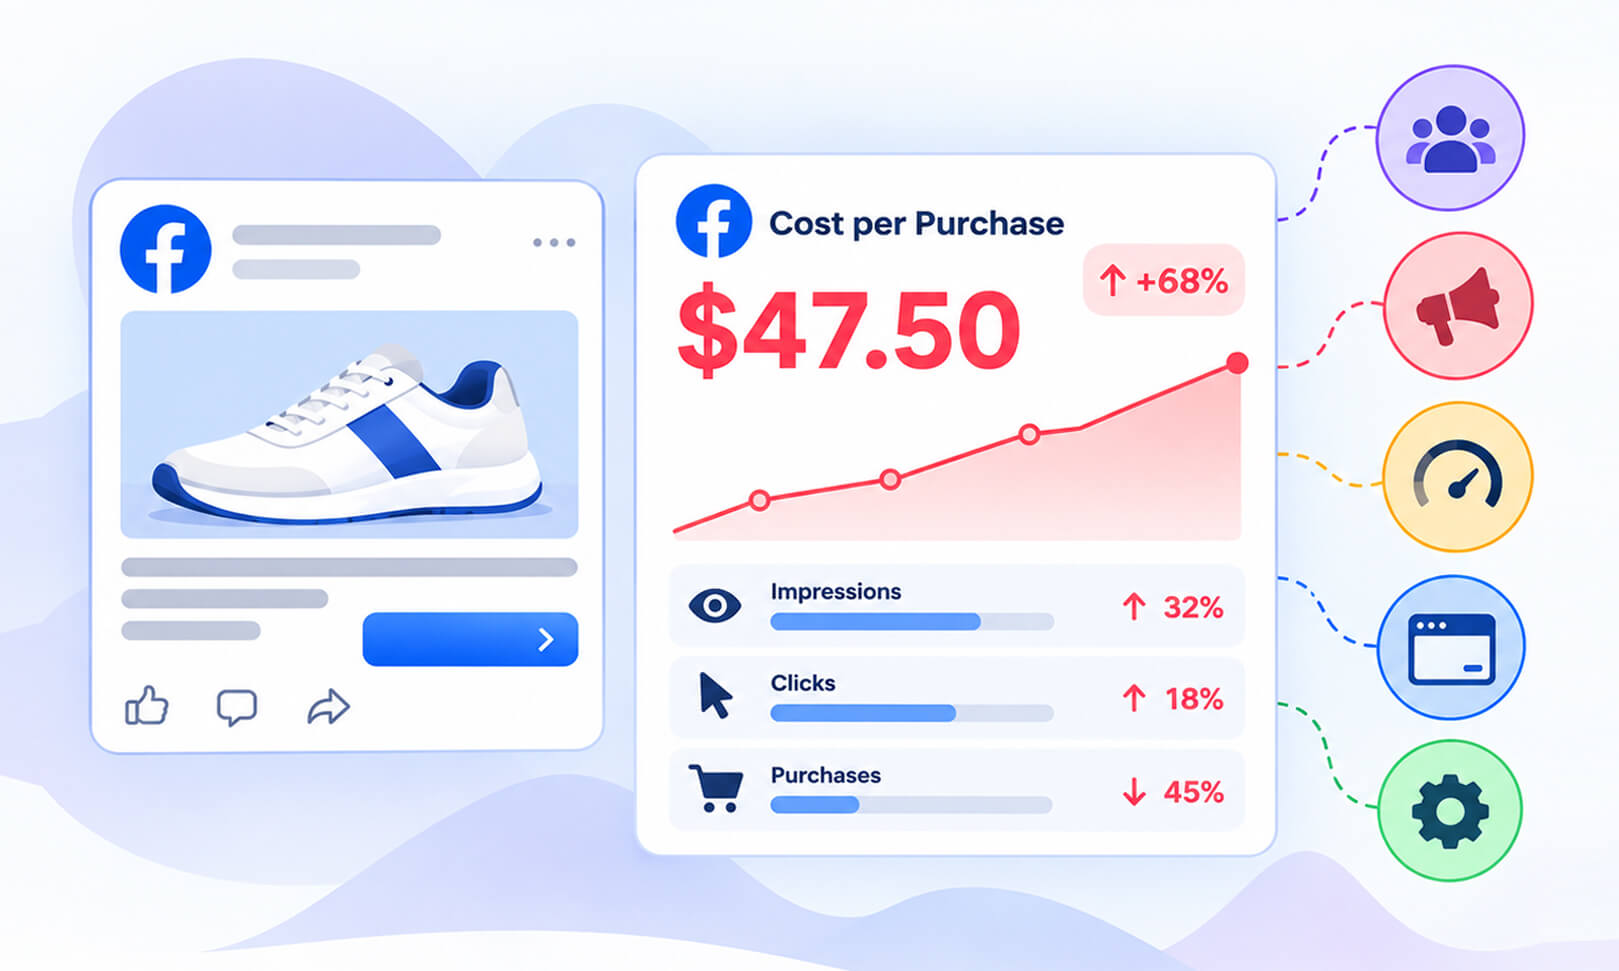
TL;DR: A high Facebook ads cost per purchase can result from expensive ad auctions, weak creatives, audience fatigue, low landing page conversion rates, slow websites, checkout issues, or inaccurate tracking. Diagnose the cause using CPM, CTR, CPC, conversion rate, and purchase data before changing your campaigns.
When your Facebook ads generate clicks but few purchases, every sale becomes more expensive. Your Facebook ads cost per purchase may rise even when traffic increases, leaving you spending more without seeing better returns.
The solution is to identify where potential customers drop off. Sometimes the problem is your targeting or ad creative. In other cases, visitors click your ads but leave because the landing page loads slowly, the offer is unclear, or checkout is difficult.
This guide explains why Facebook ads cost per purchase gets too high, how to identify the underlying problem, and what to fix first to improve profitability.
What Causes a High Facebook Ads Cost Per Purchase
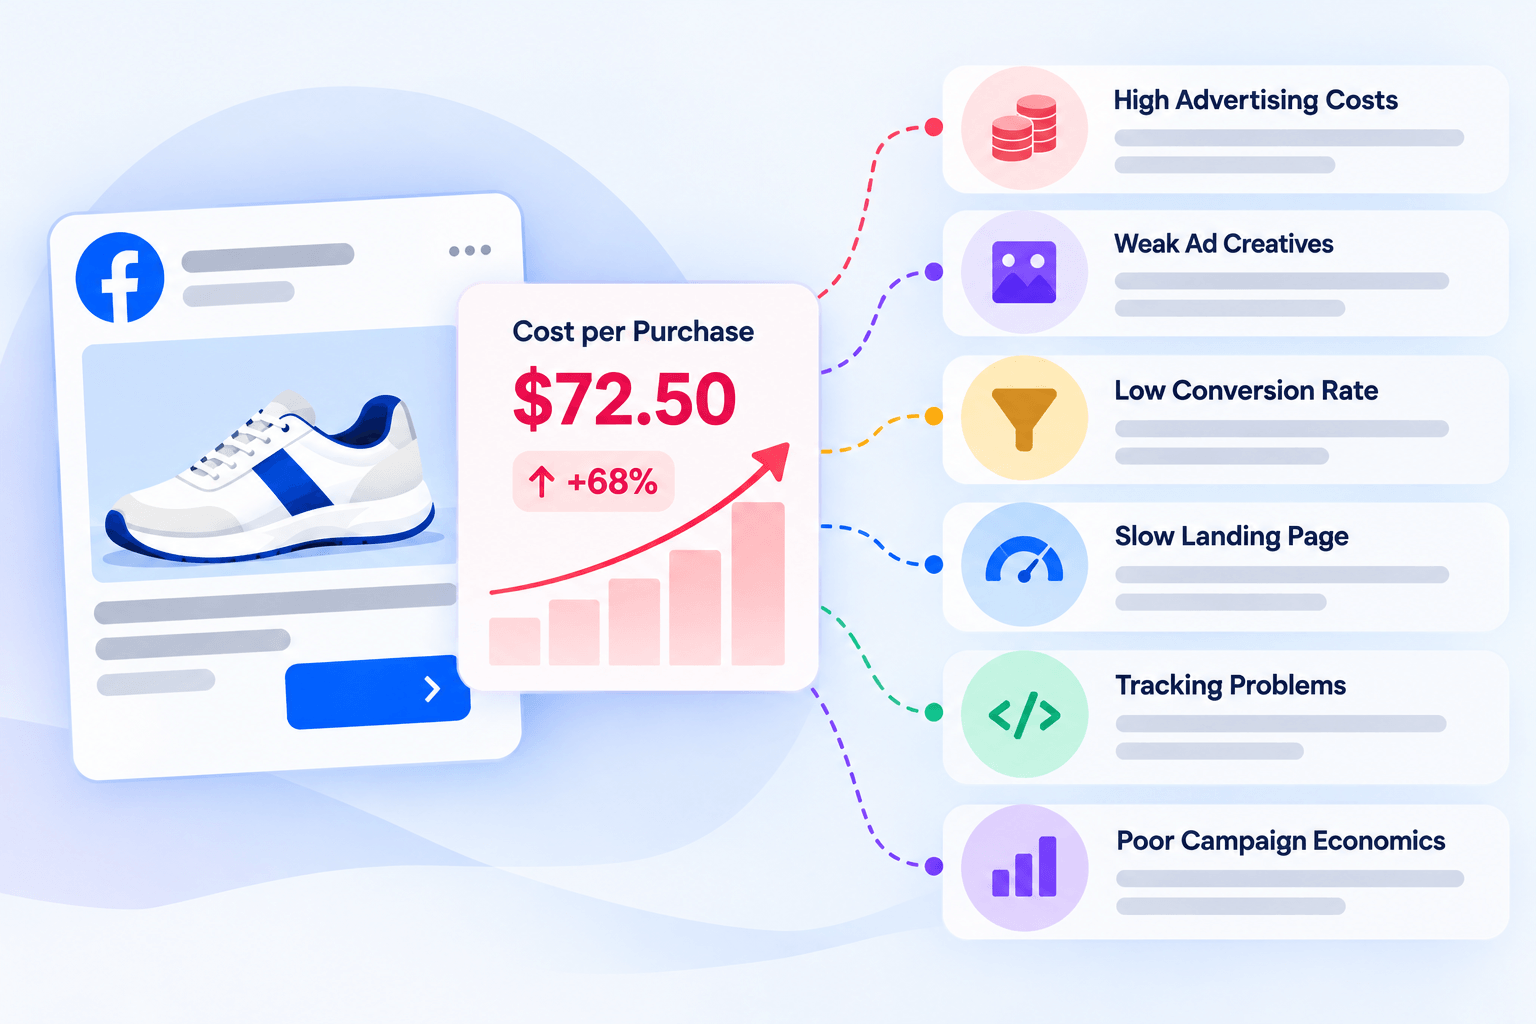
Your Facebook ads cost per purchase is high when you spend too much to generate each completed purchase. The most common causes and fixes are:
| Possible cause | What to check | What to fix |
|---|---|---|
| High advertising costs | CPM and CPC | Review audience, placements, and competition |
| Weak ad creatives | CTR and engagement | Test new hooks, visuals, and offers |
| Low conversion rate | Landing page and checkout data | Improve page clarity and purchase flow |
| Slow landing page | Load time and mobile performance | Identify and fix performance issues |
| Tracking problems | Pixel events and purchase data | Verify event setup and attribution |
| Poor campaign economics | CPA and ROAS | Set a target cost per purchase based on margins |
Start by checking where performance deteriorates. High CPM suggests expensive ad delivery, while strong clicks but few purchases point toward the post-click experience, the offer, or measurement issues. These are diagnostic clues, not definitive proof of a single cause.
What Is Facebook Ads Cost Per Purchase?
Facebook ads cost per purchase is the average amount spent on advertising to generate one purchase attributed to your campaign. It is a purchase-specific version of cost per acquisition (CPA).
Calculate it using this formula:
Cost per purchase = Total ad spend ÷ Number of attributed purchases
For example, if you spend $600 and generate 20 attributed purchases, your cost per purchase is $30.
However, a $30 cost per purchase is not automatically good or bad. If your contribution margin before advertising is $50 per order, the campaign may be profitable. If that margin is $20, you are likely losing money before accounting for any other costs.
Your target should depend on product margins, average order value, repeat purchases, and other variable expenses, not just industry averages.
7 Reasons Your Facebook Ads Cost Per Purchase Is Too High
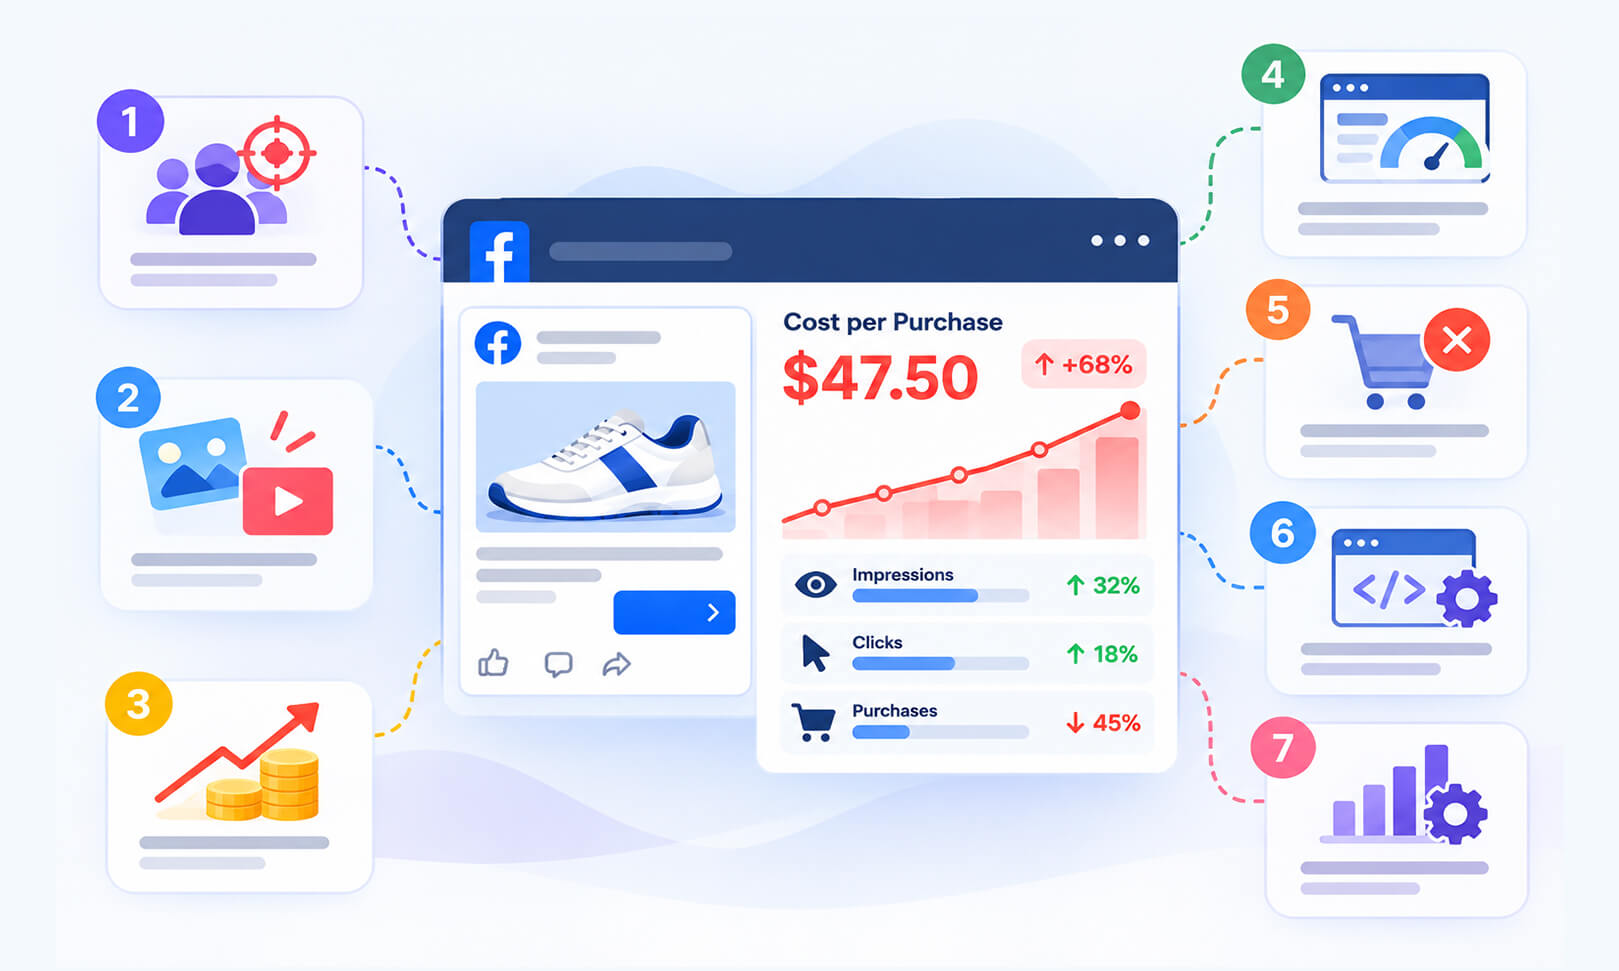
A high Facebook ads cost per purchase can stem from several issues, from expensive ad auctions and weak creatives to slow landing pages and tracking errors. Identifying the cause helps you focus on the fixes most likely to improve conversions and reduce acquisition costs.
1. Your Audience Targeting Is Too Narrow or Saturated
When your audience is too small, your ads may repeatedly reach the same people. Over time, performance can decline as those users become less responsive. Highly competitive audiences can also make ad delivery more expensive.
Check your frequency alongside CPM, CTR, and cost per purchase. Rising frequency combined with falling CTR may indicate creative fatigue or audience saturation, although frequency alone does not prove either problem.
How to fix it:
Test broader targeting where appropriate, review audience overlap, and introduce new creative variations. Avoid changing multiple targeting settings at once, because doing so makes the results harder to interpret.
2. Your Ad Creatives Are Not Generating Enough Interest
Your ad needs to attract the right people, communicate a clear benefit, and set accurate expectations about the product. If users see the ad but do not click, the message, creative, offer, or audience match may be weak.
If your Facebook ads are getting clicks but no purchases, the problem may also be a mismatch between the ad promise and the landing page. A compelling discount in an ad, for example, will frustrate visitors if the discount is missing when they arrive.
How to fix it:
Test different opening hooks, product demonstrations, customer use cases, and calls to action. Make sure the landing page delivers what the ad promises. Evaluate purchases and cost per purchase alongside CTR rather than choosing a creative based on clicks alone.
3. Your CPM or CPC Is Too High
CPM is the cost of 1,000 ad impressions, while CPC is the cost per click. Both can influence your Facebook ads cost per purchase, but neither tells the whole story.
A simple way to understand their relationship is:
Cost per purchase ≈ CPC ÷ Click-to-purchase conversion rate
If your average CPC is $1.50 and 2% of clicks become purchases, your cost per purchase is $75. If the conversion rate rises to 3%, the cost falls to $50, assuming CPC remains unchanged.
How to fix it:
Compare CPM, CTR, CPC, and conversion rate across ads, audiences, and placements. If CPC is high, investigate creative performance and auction costs. If CPC is reasonable but purchases are expensive, examine what happens after the click.
4. Your Landing Page Is Slow or Difficult to Use
A slow landing page can waste paid traffic because visitors may leave before the page finishes loading or before they understand the offer. This is especially important for mobile campaigns, where loading delays and usability issues can discourage potential customers from completing a purchase.
The landing page experience after a Facebook ad click depends on more than loading speed. Visitors also need relevant content, clear messaging, mobile usability, trust signals, and an easy path to purchase. Evaluate these factors alongside your landing page views and conversion data rather than treating them as a single Meta Ads Manager score.
Excessive JavaScript processing can delay page interactions, while unnecessary third-party scripts may add loading time or affect responsiveness. Reducing JavaScript execution time and identifying third-party scripts that affect site performance can help address these issues.
How to fix it:
Test the landing page on mobile and inspect it using Google PageSpeed Insights. Review its loading performance, large images, JavaScript execution, third-party apps, and layout stability. Then simplify the page where necessary and retest after making changes.
5. Your Offer or Checkout Is Preventing Purchases
Even when your ads attract relevant visitors, purchases can remain low if shipping costs appear unexpectedly, product information is incomplete, payment options are limited, or checkout requires unnecessary steps.
For ecommerce businesses, this means Facebook ads conversion rate can be affected by the entire purchase journey, not just the advertisement itself.
How to fix it:
Check product-page visits, add-to-cart events, checkout starts, and completed purchases. A large drop between add-to-cart and checkout completion may point to shipping costs, payment problems, or friction in the checkout process. Review the actual customer journey before changing the ad campaign.
6. Your Facebook Ads Conversion Tracking Is Incorrect
Incorrect tracking can make campaign decisions unreliable. A missing purchase event may cause Ads Manager to underreport sales, while duplicate events or inconsistent attribution can distort performance comparisons.
Meta Pixel and Conversions API help businesses measure website activity and send event data to Meta. They do not guarantee that every purchase will be tracked or attributed identically across platforms.
How to fix it:
Verify that the Purchase event fires correctly and that browser and server events are deduplicated when you use both the Meta Pixel and Conversions API. Compare Ads Manager purchase counts with your ecommerce order records over the same reporting period, accounting for differences in attribution settings and reporting delays.
If actual orders remain stable but Meta reports fewer purchases, investigate event delivery, deduplication, attribution settings, and recent tracking changes. If both actual orders and reported purchases decline, investigate campaign performance and the website experience as well. Neither pattern alone proves that tracking is the cause.
7. Your Campaign Structure or Budget Is Working Against You
Frequent edits, fragmented audiences, poorly matched campaign objectives, and budgets that are too small for meaningful testing can make it difficult to determine which ads are performing well.
If you optimize for a low-intent action instead of purchases, you may generate engagement or traffic without enough sales. Similarly, increasing budgets before confirming conversion quality can increase spend without improving profitability.
How to fix it:
Use a purchase-focused optimization event when appropriate, consolidate overlapping campaigns where practical, and give tests enough time and data to evaluate. Avoid resetting campaigns or changing several variables every day based on short-term fluctuations.
How to Reduce Facebook Ads Cost Per Purchase
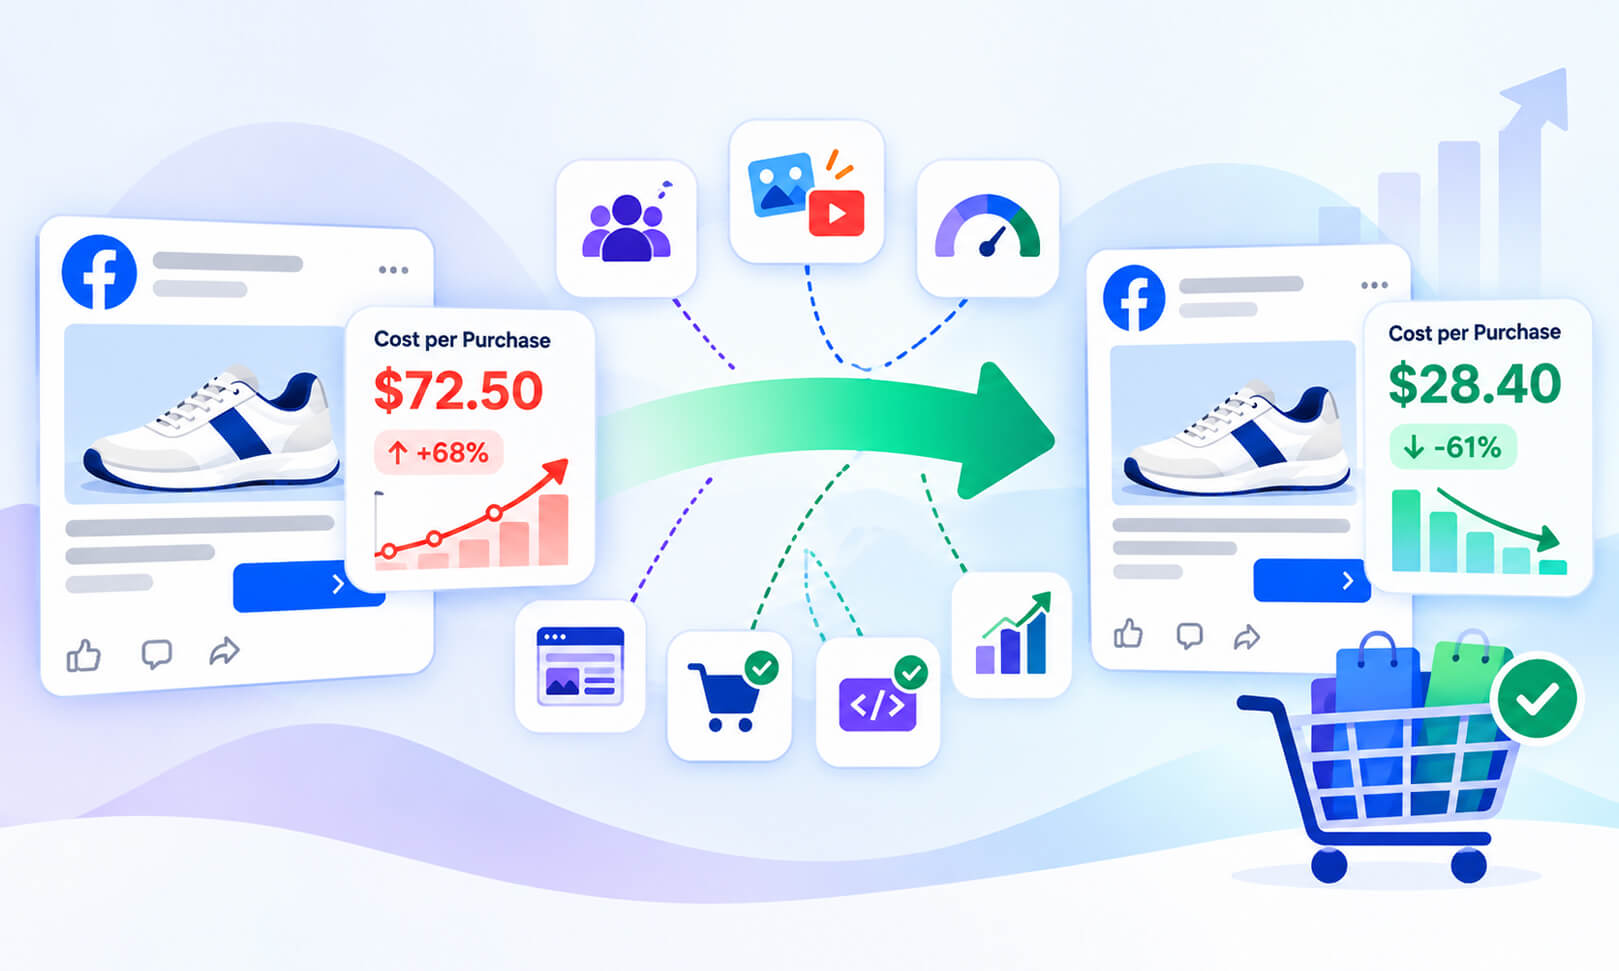
Once you identify the likely cause, make changes in a controlled order. Trying to fix targeting, creatives, budgets, and landing pages simultaneously makes it difficult to know what actually improved results.
Step 1: Identify Where the Funnel Breaks
Review your campaign metrics together rather than looking at cost per purchase in isolation. Compare CPM, CTR, CPC, landing page views, add-to-cart events, checkout starts, and purchases over the same reporting period.
Use these patterns to identify where performance may be breaking down:
| What You Notice | Possible Cause | What to Check |
|---|---|---|
| CPM increases | Higher impression costs or changes in auction conditions | Audience composition, placements, and competition |
| CTR decreases | Ads may be less relevant or engaging | Creative, messaging, offer, and audience relevance |
| Clicks remain steady, but landing page views decrease | Visitors may not be reaching the page successfully | Page loading, redirects, destination errors, and tracking |
| Landing page views remain steady, but add-to-cart events decrease | Product-page or offer issues | Pricing, product information, offer clarity, and mobile usability |
| Checkout starts remain steady, but purchases decrease | Checkout friction or payment issues | Shipping costs, payment options, checkout errors, and purchase tracking |
These patterns are diagnostic clues, not definitive proof of the cause. Check the relevant data before making changes.
Start with the stage showing the clearest decline. If visitors are clicking but not reaching your landing page, investigate page performance first. If they reach the page but do not add products to their carts, review the product page and offer. If they start checkout but do not complete their purchases, investigate checkout friction and payment options.
If your website’s conversion rate has declined, review the landing page experience alongside your ad metrics. Improving page speed, mobile usability, and the purchase process may help turn more existing visitors into customers without requiring additional ad spend.
Step 2: Improve the Landing Page Before Buying More Traffic
If clicks are coming in but purchases are not, inspect the landing page before increasing your budget. Check whether the main product benefit is immediately clear, the price and shipping details are easy to find, and the page works properly on mobile devices.
A useful starting point is to test your website with Google PageSpeed Insights, then review the page manually. Performance scores help identify technical issues, but they do not replace real purchase-funnel data.
For websites that need further optimization, tools such as Website Speedy can help address performance issues that affect loading speed. The specific improvements needed depend on the website, so retest the landing page after making changes and check whether the experience improves on mobile devices.
Step 3: Calculate Your Target CPA and Review ROAS
To lower CPA on Meta ads for ecommerce, set a target based on what each order can afford to spend on advertising.
Suppose your average order value is $80, and your contribution margin before advertising is $32 per order. Spending $40 to acquire that order would leave you below break-even before accounting for other excluded expenses. A $20 cost per purchase would leave $12 from that contribution margin.
Facebook ads ROAS provides another perspective:
ROAS = Attributed purchase revenue ÷ Ad spend
If you spend $500 and generate $1,500 in attributed revenue, your ROAS is 3x. However, a 3x ROAS does not automatically mean the campaign is profitable. Product costs, shipping, returns, discounts, and other expenses still matter.
Set your target CPA and ROAS using your actual margins, and compare campaigns over consistent reporting periods.
Treat break-even CPA as an upper limit for covering the costs included in your margin calculation, not automatically as your ideal target. Operating expenses, profit goals, and expected customer lifetime value may justify a lower acquisition-cost target.
Step 4: Test One Meaningful Change at a Time
Create a clear hypothesis before changing a campaign. For example, if CTR has declined while frequency has increased, test fresh creative variations. If clicks remain steady but checkout completion falls, investigate the checkout experience.
Keep a record of the change, the date, the spend, and the resulting purchases. This helps separate genuine improvement from normal fluctuations in advertising performance.
Conclusion
A high Facebook ads cost per purchase is a signal to investigate the full customer journey, from ad impression to completed order. Review auction costs, creative performance, landing page experience, checkout behavior, and conversion tracking before making major campaign changes.
The most effective approach is to identify the weakest part of the funnel, test a targeted fix, and measure whether it improves purchase costs and profitability. Lower CPA matters most when it helps your business acquire customers profitably and consistently.
Frequently Asked Questions
1. Why is my Facebook ads cost per purchase so high?
2. How do I reduce cost per purchase on Facebook ads?
3. Can a slow website increase Facebook ads cost per purchase?
4. Why are my Facebook ads getting clicks but no purchases?
5. What is the difference between CPA, cost per purchase, and ROAS?
6. How do I know whether my Facebook ads CPA is increasing because of my website?
About the Author