



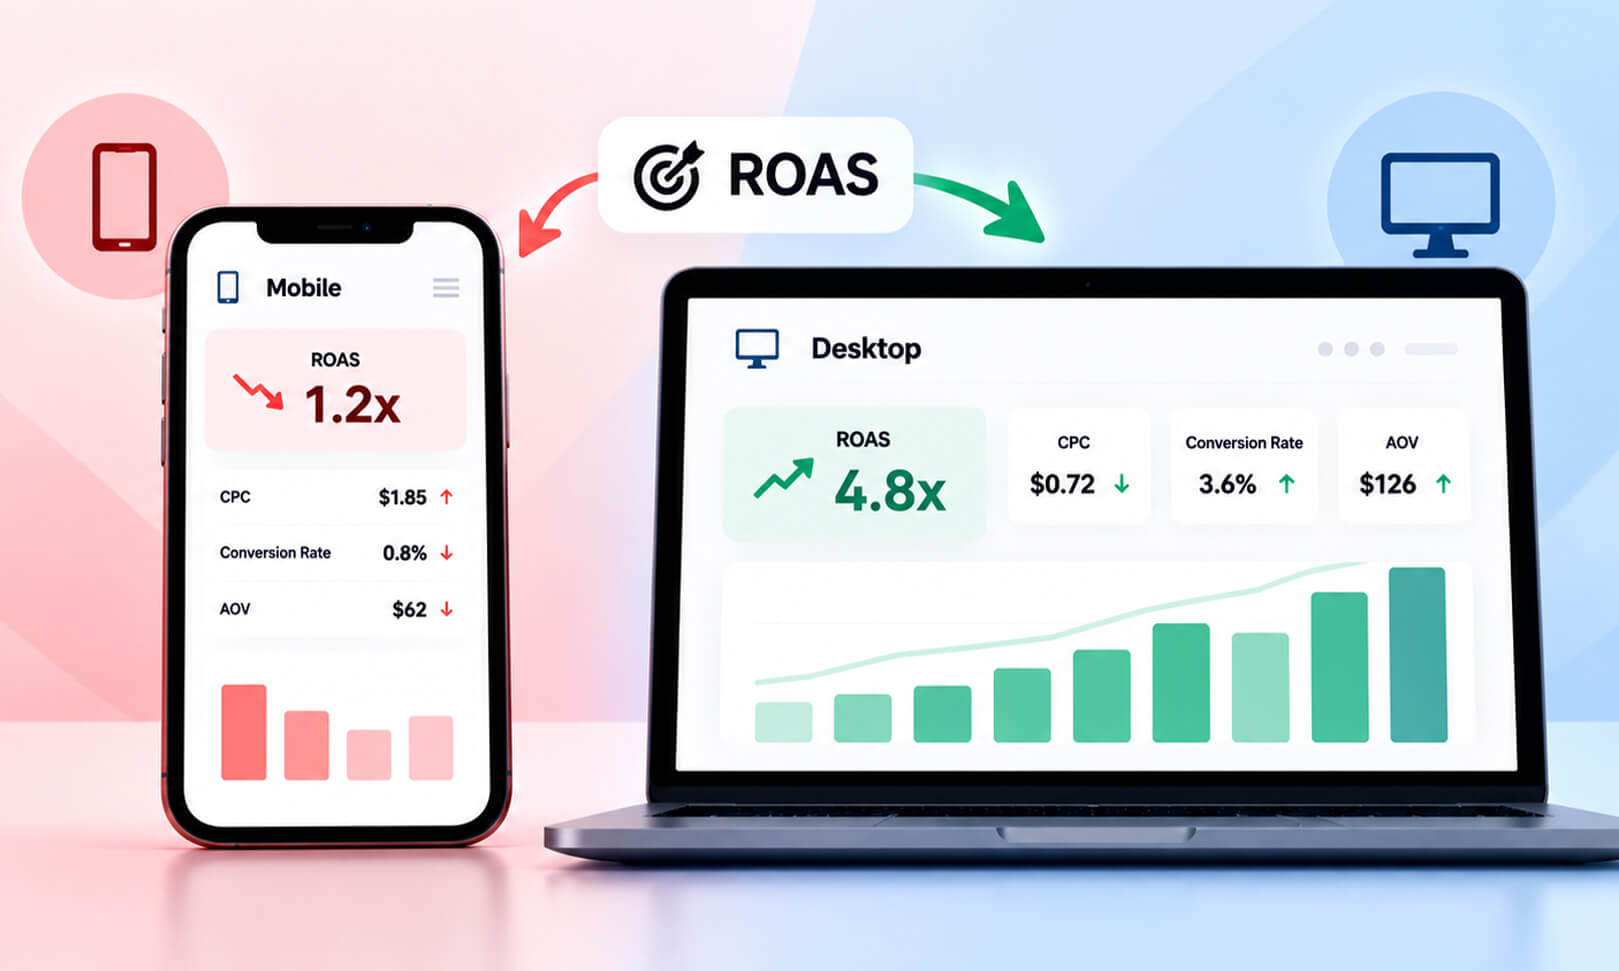
TL;DR: ROAS can be lower on mobile because mobile visitors may face slower pages, more checkout friction, higher CPCs, smaller screens, and different shopping behavior. Tracking can also make mobile performance look weaker when users click on mobile but purchase later on desktop. Before deciding what needs fixing, compare device-level spend, conversion rate, conversion value, CPC, checkout behavior, and cross-device conversions.
If your ROAS is lower on mobile than desktop, don’t assume your mobile ads are the problem. The gap can come from several points in the customer journey, including slower mobile pages, higher CPCs, checkout friction, different shopping behavior, or attribution differences.
The good news is that you can usually narrow down the cause by comparing mobile and desktop performance at each stage of the funnel. Check where mobile starts losing users, then fix that specific issue instead of changing your entire ad strategy.
This guide breaks down the main reasons for lower ROAS on mobile and the practical fixes you can use to improve mobile performance.
What Causes Lower Mobile ROAS and How Can You Fix It?
A lower mobile ROAS can come from slower pages, checkout friction, higher CPCs, cross-device shopping, or attribution gaps. Identify where mobile performance drops, then fix the specific issue affecting conversions and revenue.
| Cause | Why ROAS Falls | Fix |
|---|---|---|
| Slow mobile pages | Visitors leave before engaging. | Improve mobile speed. |
| Checkout friction | More users abandon purchases. | Simplify checkout. |
| Higher CPC | Clicks cost more. | Review bids and targeting. |
| Cross-device shopping | Mobile gets less credit for purchases. | Check cross-device conversions. |
| Attribution gaps | Conversions may be misreported. | Audit tracking and attribution. |
| Lower conversion rate | Fewer clicks become purchases. | Find and fix funnel drop-offs. |
| Overall mobile performance | Multiple issues can compound. | Compare device-level data and fix the biggest gap first. |
What Is ROAS and How Do You Calculate It?
ROAS (return on ad spend) measures how much conversion value your advertising generates for every dollar spent. It is calculated by dividing attributed conversion value by advertising cost.
ROAS Formula:
ROAS = Attributed Conversion Value ÷ Advertising Cost
For example, if your mobile ads generate $600 in attributed revenue from $300 in ad spend, your ROAS is 2.0x (200%). If your desktop ads generate $900 from the same $300 spend, your ROAS is 3.0x (300%).
ROAS measures attributed conversion value, not profit. To evaluate profitability, you also need to account for product costs, fulfillment, discounts, and other business expenses.
When comparing mobile and desktop ROAS, identify where mobile performance drops rather than assuming the problem lies with the advertising itself.
What Causes the Mobile vs. Desktop ROAS Gap?
Several factors can explain this gap, from conversion and checkout issues to advertising costs and attribution differences.
The most common reasons are:
-
Lower mobile conversion rates
Mobile visitors may be less likely to complete a purchase because of smaller screens, usability issues, or more friction during the buying journey.
-
Slower mobile performance
Slow-loading pages can cause visitors to leave before they view products or take action.
-
Checkout friction
Difficult forms, payment issues, or unexpected costs can cause more mobile shoppers to abandon their purchases.
-
Higher CPC
If mobile clicks cost more without generating proportionally more conversion value, ROAS decreases.
-
Different shopping behavior
Some customers research or click ads on mobile but complete their purchase later on desktop.
-
Attribution differences
Cross-device conversions, tracking limitations, or attribution settings can make mobile appear less valuable than it actually is.
The key is to identify where mobile performance drops compared with desktop rather than assuming the lower ROAS is caused by advertising alone.
Is It Normal for Mobile ROAS to Be Lower Than Desktop?
Yes, it can be normal for mobile ROAS to be lower than desktop, particularly for businesses where customers research on phones but complete higher-value purchases later on larger screens.
Mobile users also interact with websites under different technical conditions. Google notes that mobile devices are generally more resource-constrained and can operate on less stable networks than desktop devices.
But “normal” should not become an excuse to ignore a large or sudden gap. Compare mobile and desktop over a meaningful period and look at:
- Spend
- CPC
- Click-through rate
- Conversion rate
- Conversion value
- Average order value
- Cost per conversion
- Checkout abandonment
- Landing-page performance
- Cross-device conversions
If mobile receives substantially more traffic but loses users between landing and checkout, the ROAS gap is probably not just a device preference.
Why Do Mobile Ads Convert Worse Than Desktop Ads?
There is no universal rule that mobile ads convert worse than desktop ads. The difference often appears after the click, when visitors interact with the website.
A mobile visitor has less screen space, may be using a slower connection, and may need to navigate forms and product information with touch rather than a mouse and keyboard.
The ad itself may also attract a different type of intent. Someone searching casually on a phone may be earlier in the buying journey than someone researching a purchase on a desktop.
This is why comparing only conversion rates can be misleading. Look at the complete funnel:
Ad impression → click → landing page → product interaction → add to cart → checkout → purchase
If mobile CTR is strong but add-to-cart or checkout completion is weak, changing the ad may not solve the problem. The friction may be on the website.
Google also recommends evaluating landing-page experience alongside conversion rate, ad relevance, and expected CTR when diagnosing advertising performance.
Could Mobile Landing Page Speed Be Lowering ROAS?
Absolutely. A paid click has already consumed part of your advertising budget before the visitor even sees the landing page. If that page takes too long to become useful, the potential value of the click decreases.
Google specifically identifies landing-page loading speed as an important part of the landing-page experience and notes that faster landing pages typically lead to more conversions.
The problem is not necessarily the server alone. Mobile performance can be affected by:
- Oversized images
- Heavy JavaScript
- Render-blocking resources
- Third-party tracking scripts
- Chat and personalization tools
- Large DOMs
- Video backgrounds
- Slow checkout scripts
For a deeper diagnosis, compare mobile and desktop Core Web Vitals (LCP, INP, and CLS). Google recommends an LCP of 2.5 seconds or less, INP of 200 milliseconds or less, and CLS of 0.1 or less for a good user experience.
Field data is particularly useful because lab testing alone cannot show exactly how real mobile visitors experience the site.
Can Mobile Checkout Friction Reduce ROAS?
Yes. A visitor can arrive through a profitable ad, like the product, add it to the cart, and still fail to purchase because checkout is difficult.
Mobile checkout friction can include:
- Too many form fields
- Poor keyboard behavior
- Difficult address entry
- Forced account creation
- Payment failures
- Unexpected shipping costs
- Tiny buttons or controls
- Slow payment processing
- Layout shifts while completing the order
Baymard’s ongoing checkout research identifies address and payment entry as major areas of checkout friction and recommends features such as address lookup and browser autofill to make data entry easier.
Speed matters here too. Checkout pages can contain payment gateways, fraud detection, analytics, shipping APIs, and other dynamic functionality.
The important distinction is that mobile ROAS can fall even when the advertising itself is fine if the post-click experience prevents enough users from completing the purchase.
Can Cross-Device Shopping Behavior Make Mobile ROAS Look Lower?
Yes, and this is one of the easiest explanations to overlook.
Imagine this journey:
Monday: Customer clicks your ad on a smartphone.
Tuesday: Customer researches the product again.
Wednesday: Customer purchases on a laptop.
A mobile-to-desktop purchase does not automatically mean that mobile advertising receives no credit. In Google Ads, cross-device conversions can be reported under the device where the ad click occurred when performance is segmented by device. Some cross-device conversions are modeled because the complete customer journey cannot always be observed directly.
However, attribution and reporting methods differ across platforms. If mobile ROAS appears unusually low, compare the device-level reporting in your ad platform with your analytics data. Check whether conversion windows, attribution settings, consent limitations, or tracking coverage could explain the difference.
Before concluding that mobile traffic is less valuable, verify how your specific reporting setup assigns conversion credit.
Does Mobile Ad CPC Affect ROAS?
Yes, but CPC is only one part of the equation.
If mobile CPC rises while conversion rate and average order value remain unchanged, you are paying more for the same expected conversion value. That puts downward pressure on ROAS.
For example:
| Metric | Desktop | Mobile |
|---|---|---|
| CPC | $1.00 | $1.25 |
| Conversion rate | 4% | 3% |
| Average order value | $100 | $100 |
| Revenue per click | $4.00 | $3.00 |
| Illustrative ROAS | 4.0x (400%) | 2.4x (240%) |
In this simplified example, desktop generates $4 in revenue for every $1 spent on advertising, while mobile generates $2.40. Mobile ROAS is lower because clicks cost more and a smaller share of visitors convert. These figures are illustrative; actual ROAS depends on attributed conversion value, ad spend, conversion measurement, and the reporting period.
Mobile is costing more per click while producing fewer conversions per click. That combination can create a substantial ROAS gap.
However, don’t automatically respond by cutting mobile bids. First, determine why CPC is higher. Competition, auction conditions, campaign structure, targeting, ad relevance, and landing-page experience can all influence advertising costs and performance. Google notes that ad quality and landing-page experience can affect ad position and cost.
Can Tracking or Attribution Differences Affect Mobile ROAS?
Yes. A mobile ROAS comparison becomes unreliable when the underlying conversion measurement is inconsistent.
Check whether:
- Purchase conversion values and currencies are recorded correctly.
- Purchase events fire consistently on mobile and desktop.
- Consent settings or browser restrictions affect measurement coverage.
- Cross-device conversions are reported where the platform supports them.
- Google Ads and Google Analytics use clearly understood conversion definitions and attribution settings.
- Conversion delays are accounted for when comparing reporting periods.
- Duplicate or missing purchase events are affecting reported revenue.
Treat Google Ads and Google Analytics as complementary reporting sources rather than expecting their conversion totals or ROAS figures to match exactly.
Google warns that conversion reporting can differ because of factors such as conversion delays, cross-device conversions, attribution settings, view-through conversions, and other measurement differences.
This is particularly important after implementing a new analytics setup, changing conversion actions, redesigning checkout, or switching attribution configurations.
How Do You Check Mobile vs. Desktop Performance in Your Ad Account?
Start with the ad platform rather than guessing from total ROAS.
In Google Ads, segment campaign performance by Device. Google specifically recommends device segmentation to compare clicks, impressions, and conversions between desktop and mobile.
Then build a simple comparison:
| Metric | Mobile | Desktop | What to investigate |
|---|---|---|---|
| Spend | $1,000 | $1,000 | Budget allocation |
| CPC | $1.25 | $1.00 | Auction and bidding |
| CTR | 3.0% | 4.0% | Ad relevance |
| Conversion rate | 2.4% | 4.0% | Post-click experience |
| Conversion value | $2,400 | $4,000 | Revenue contribution |
| AOV | $100 | $100 | Product/customer mix |
| ROAS | 2.4x (240%) | 4.0x (400%) | Overall efficiency |
| Checkout completion | 50% | 70% | Checkout friction |
| Cross-device conversions | Check account data | Check account data | Attribution effects |
These figures are illustrative examples, not actual industry benchmarks. Checkout completion and cross-device conversion figures depend on how your analytics and ad platforms define and report them.
This makes the diagnosis much clearer.
For example, high mobile CPC + normal conversion rate suggests a different problem from normal CPC + poor mobile conversion rate.
Likewise, strong mobile conversion rate + low reported ROAS deserves a closer look at conversion values and attribution rather than immediately changing the landing page.
How Can You Improve Mobile ROAS?
Once you know where the gap occurs, fix the corresponding part of the funnel to improve ROAS.
1. Improve mobile landing-page performance
Start with the page users reach immediately after the ad click. Identify the LCP element, reduce unnecessary JavaScript, optimize images, remove unnecessary third-party scripts, and make important content interactive quickly.
2. Audit third-party scripts
Analytics, pixels, chat, heatmaps, personalization, reviews, and other integrations can add considerable browser work. Not every script needs to load immediately. Some can be removed, deferred, or loaded only where they are required.
3. Simplify mobile checkout
Test the complete purchase journey on an actual phone.
Check address entry, autofill, payment methods, error messages, shipping information, button sizes, and page responsiveness. A checkout that works technically can still create unnecessary friction.
4. Improve landing-page relevance
Make sure the ad promise and landing page match. If an ad promotes a specific product, discount, or category, users should immediately find what they expected after clicking. Google recommends keeping the ad and landing-page messaging consistent.
5. Investigate CPC and bidding separately
If mobile conversion performance is healthy but CPC is significantly higher, investigate the auction and campaign structure before making website changes.
Likewise, don’t reduce mobile spend simply because the reported ROAS is lower until you have checked cross-device conversions and attribution.
6. Test changes against conversion value, not just speed
A faster page is useful, but the business outcome is what matters.
After making a performance change, monitor mobile conversion rate, revenue per session, checkout completion, cost per conversion, conversion value, and ROAS. Use controlled testing where practical rather than assuming that an improvement in a PageSpeed score automatically produces more revenue.
Google’s own performance guidance also recommends looking beyond isolated metrics and considering conversion-related outcomes when evaluating advertising performance.
A Practical Way to Diagnose a Mobile ROAS Gap
A useful troubleshooting sequence is:
1. Confirm the gap.
Compare the same date range, campaigns, conversion actions, attribution settings, and conversion window.
2. Check CPC.
If mobile traffic costs substantially more, determine whether the difference comes from bidding, competition,
targeting, or ad quality.
3. Check conversion rate.
If mobile clicks convert less often, move downstream and inspect the landing page, product experience, and checkout.
4. Check speed.
Compare real-user mobile and desktop performance, particularly LCP and INP.
5. Check checkout.
Look for mobile-specific abandonment between cart and purchase.
6. Check attribution.
Review cross-device conversions, conversion delays, tracking coverage, and conversion values.
7. Recalculate the economics.
Look at ROAS alongside profit margin, AOV, customer lifetime value, and assisted conversions where available.
This prevents a common mistake: treating every mobile ROAS problem as an advertising problem.
Conclusion
A Return on Ad Spend lower on mobile is a useful diagnostic signal, but it is not a diagnosis by itself.
The gap may come from higher CPC, weaker conversion rates, slower mobile pages, checkout friction, different customer intent, cross-device shopping behavior, or attribution differences. In many cases, several factors contribute at the same time.
Start by comparing mobile and desktop at every stage of the funnel. Then connect the biggest difference to a specific cause: advertising cost, landing-page performance, checkout usability, or measurement.
That approach gives you a much clearer path to improving mobile ROAS without making campaign or website changes based on a single metric.
FAQs
Is mobile ROAS always lower than desktop ROAS?
Why is my mobile conversion rate lower even though mobile traffic is high?
Does a slow mobile website affect paid advertising performance?
Should I reduce mobile ad spend if mobile ROAS is lower?
How can I tell whether mobile checkout is causing low ROAS?
How long should I wait before judging a change in mobile ROAS?
About the Author