


Introduction
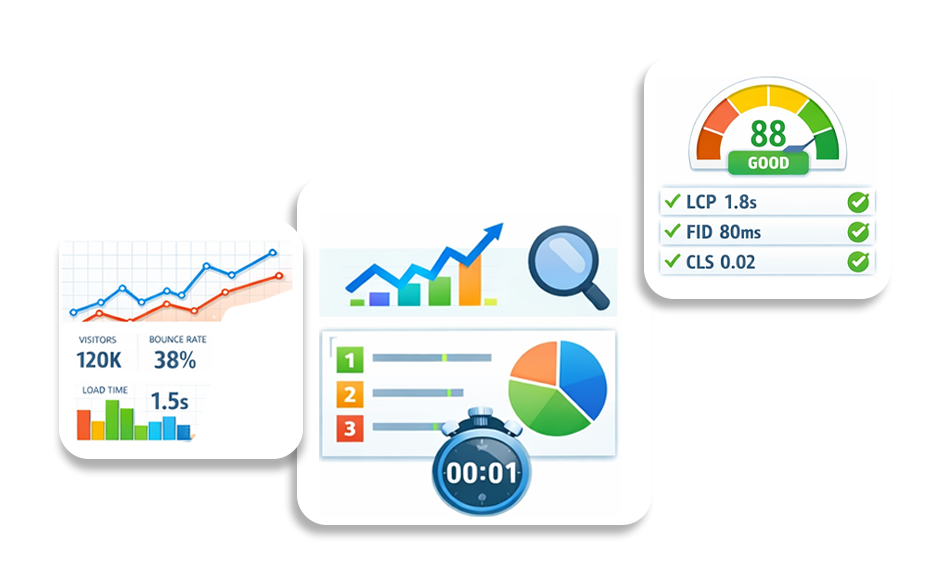
Website speed is a critical factor that significantly influences user experience and search engine optimization. Slow-loading websites can frustrate visitors, leading to high bounce rates and negatively impacting a site’s search engine rankings. With updated speed, it’s also important to compare the speed with the old speed. This helps to take the necessary steps for website optimization.
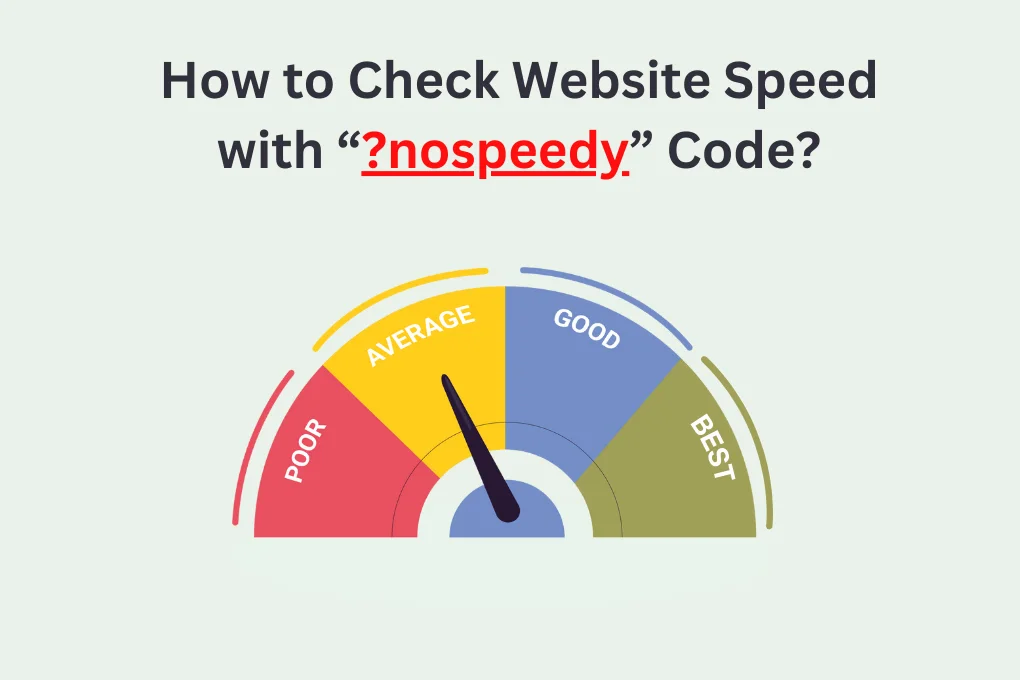
Where Website Speedy helps to boost your website speed in minutes; it also enables you to analyze your website speed with and without Website Speedy. With a simple parameter “?nospeedy” one can check their before and after website speed.
Let’s delve into the intricacies of using the “?nospeedy” code and how it can be utilized in conjunction with three prominent tools – Google PageSpeed Insights, GTmetrix, and Pingdom – to assess and enhance website speed.
Understanding “?nospeedy” Code
The “?nospeedy” code is a unique identifier appended to the end of a website’s URL to trigger the Website Speedy Tool. Placing this code at the end of the URL allows the tool to analyze the previous speed performance of the website comprehensively. The “?nospeedy” code essentially serves as a key to unlocking valuable insights into a website’s loading speed, aiding developers and website owners in optimizing their sites for improved performance.
Google PageSpeed Insights

Accessing the Tool:
- Navigate to the Google PageSpeed Insights website.
- Locate the input field for the website URL.
Inputting “?nospeedy” Code:
- Append the “?nospeedy” code to the end of the website URL.
- Enter the complete URL with the “?nospeedy” code into the provided field. Example: www.abc.com/?nospeedy
Generating Report:
- Initiate the analysis by clicking on the “Analyze” or similar button.
- Allow Google PageSpeed Insights to process the request and generate a detailed report.
Interpreting Results:
- Review the performance scores provided, focusing on metrics like FCP, LCP, and CLS.
- Pay attention to field data (real-user monitoring) and lab data (simulated testing) for a comprehensive understanding.
- Examine the recommendations provided by the tool to address specific areas for improvement.
GTmetrix
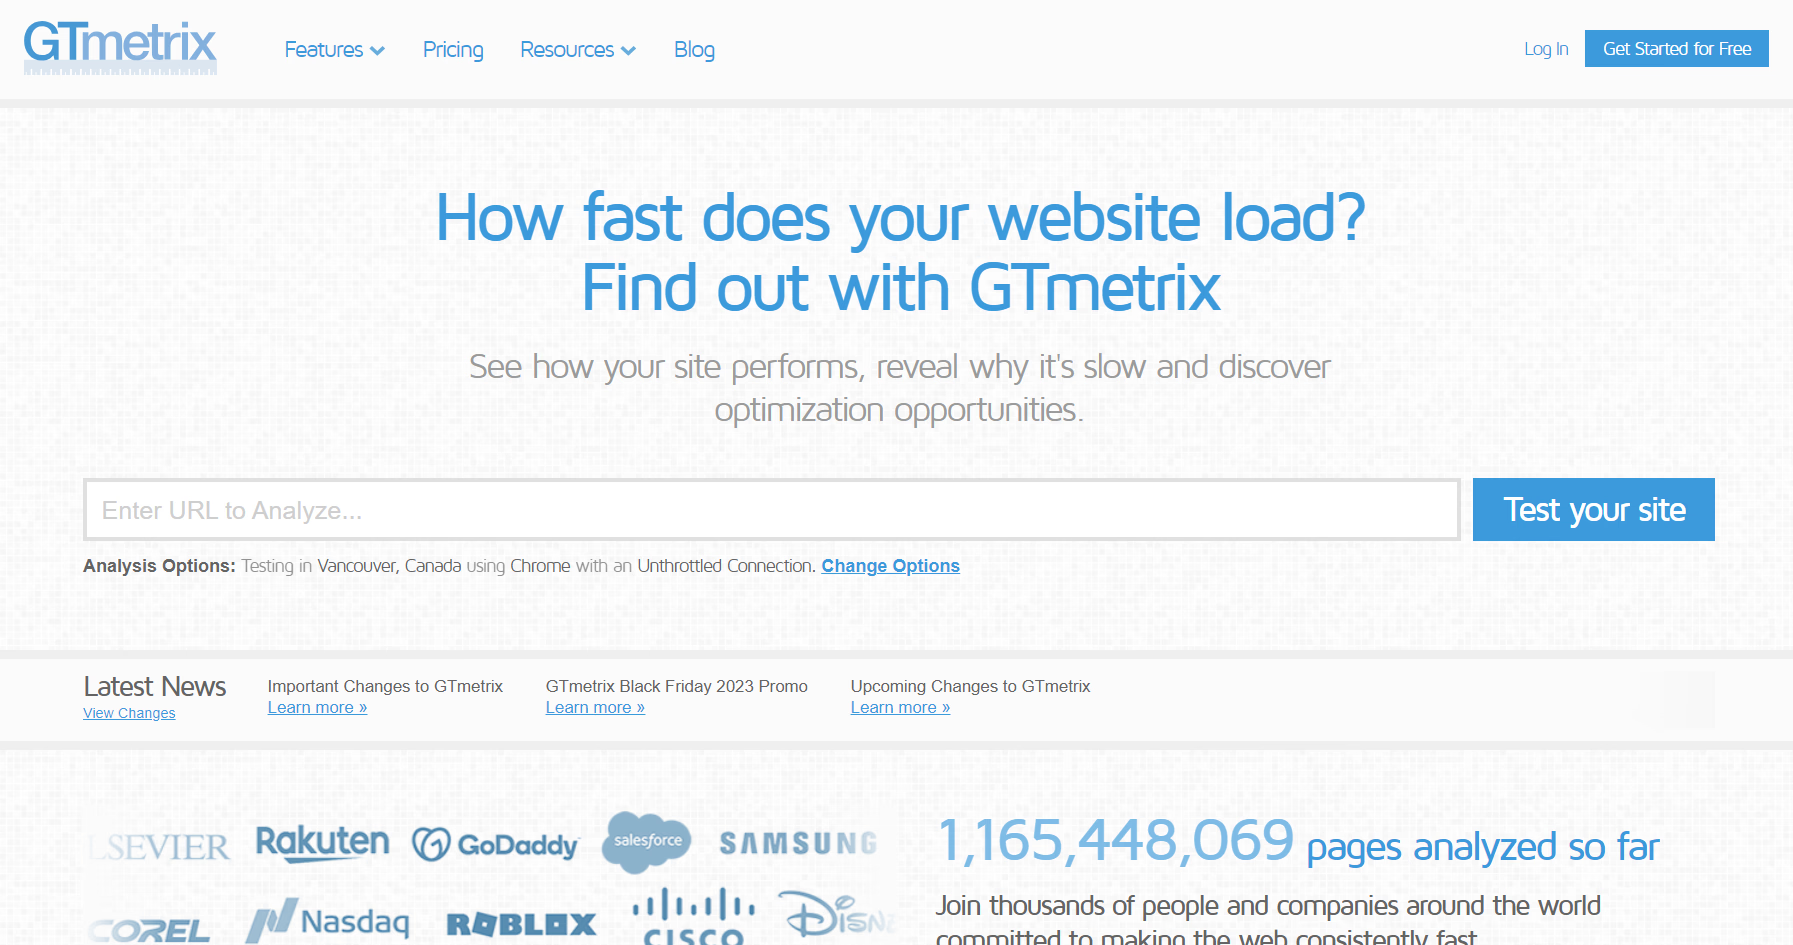
Visit GTmetrix:
- Access the GTmetrix website through a web browser
Entering “?nospeedy”-Enhanced URL:
- Input the website URL with the “?nospeedy” code at the end into the designated field. Example: www.abc.com/?nospeedy
Running Analysis:
- Initiate the analysis by clicking on the “Test your site” or similar button.
- Allow GTmetrix to analyze the website and generate a detailed performance report.
Reviewing Metrics:
- Explore key metrics, including PageSpeed and YSlow scores, fully loaded time, total page size, and the number of requests.
- Examine the waterfall chart to identify the loading sequence of elements and potential bottlenecks.
Analyzing Waterfall Chart:
- Explore the waterfall chart to visualize the loading sequence of various elements on the website.
- Identify elements causing delays and analyze suggestions provided by Pingdom for optimization.
- Review performance metrics, including load time, page size, and the number of requests, for a comprehensive understanding.
Pingdom
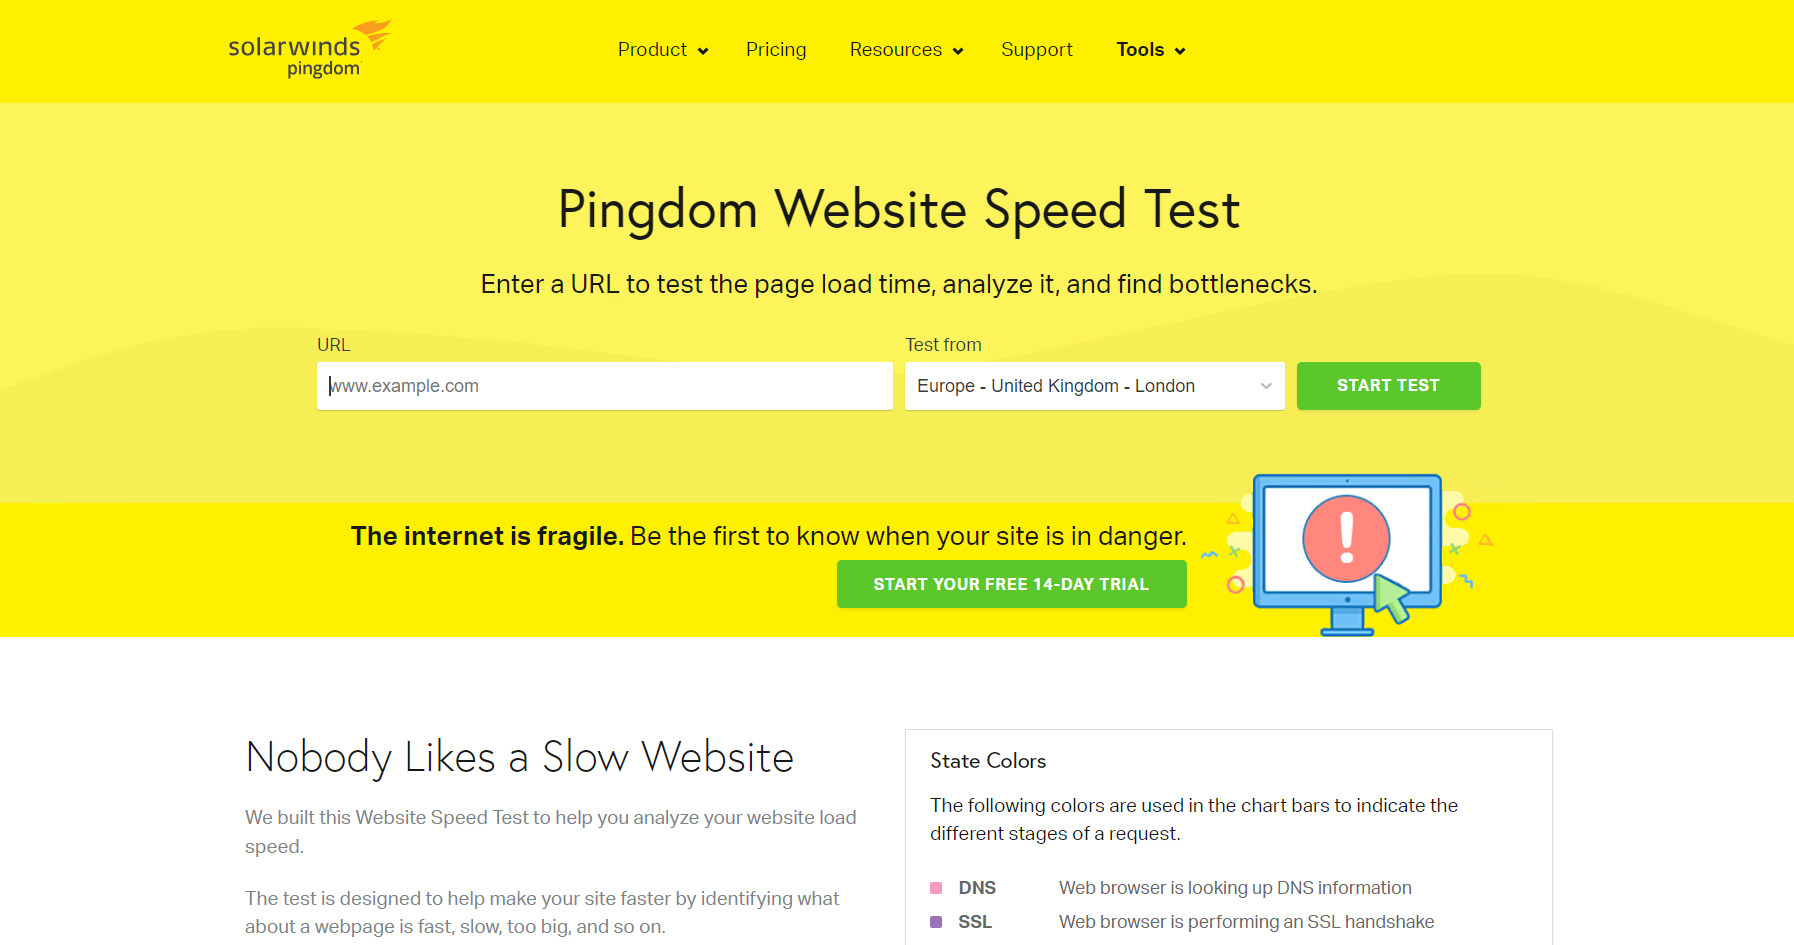
Accessing Pingdom:
- Visit the Pingdom website using a web browser.
Inserting “?nospeedy” Code URL:
- Input the website URL appended with the “?nospeedy” code in the provided field. Example: www.abc.com/?nospeedy
Initiating Test:
- Begin the performance test by clicking on the “Test Now” or similar button.
- Allow Pingdom to analyze the website and provide performance insights.
Review the Test Results:
- Analyze results and identify areas for improvement based on Pingdom’s suggestions.
Report Breakdown:
- Page Load Time
- Performance Grade
- Recommendations
Comparative Analysis
Comparing results from Google PageSpeed Insights, GTmetrix, and Pingdom is crucial for obtaining a comprehensive understanding of a website’s performance. Each tool employs different methodologies and metrics, and a combined analysis helps prioritize recommendations.
While one tool may emphasize server response time, another may focus on image optimization. By considering insights from multiple sources, developers can create a prioritized action plan for optimizing their websites effectively.
Utilizing “?nospeedy” Data for Optimization
Interpreting “?nospeedy” data is instrumental in identifying specific areas for improvement. The “?nospeedy” code not only provides a snapshot of the website’s speed but also highlights potential bottlenecks and areas for enhancement.
Implementing best practices, such as optimizing images, leveraging browser caching, and minimizing server response time, based on “?nospeedy” data can lead to significant speed improvements. Regular monitoring using “?nospeedy” ensures that optimizations remain effective over time.
Conclusion
In conclusion, website speed is a critical aspect of online success, impacting both user satisfaction and search engine rankings. The “?nospeedy” code, combined with tools like Google PageSpeed Insights, GTmetrix, and Pingdom, offers a comprehensive approach to evaluating and enhancing website speed.
By understanding the nuances of each tool and utilizing “?nospeedy” data for optimization, developers and website owners can create faster, more efficient websites that provide a superior user experience.