


TL;DR: Google PageSpeed Insights (PSI) analyzes website speed and Core Web Vitals using real user data (CrUX) and Lighthouse audits. PSI directly impacts SEO rankings and user experience. This guide explains PSI metrics, why they matter, and how to fix common performance issues to improve rankings, UX, and conversions.
Google PageSpeed Insights shows whether your website truly performs or simply looks good. No matter how strong your design or content is, a slow site loses rankings, users, and conversions.
In today’s mobile-first world, even a 3-second delay can drive visitors away and hurt SEO. Website speed directly impacts SEO rankings, conversions, search visibility, and user experience.
Google PageSpeed Insights goes beyond basic speed testing. Using real user data and Lighthouse audits, it highlights performance issues and provides clear recommendations to improve load time, Core Web Vitals, and rankings for websites.
This guide helps you understand Google PageSpeed Insights, its key metrics, and how to fix speed issues effectively.
What is Google PageSpeed Insights?
Google PageSpeed Insights (PSI) is a free performance analysis tool by Google that measures how fast and stable your web pages load on mobile and desktop devices. It evaluates real user experience data from Chrome users and combines it with Lighthouse-based lab testing to deliver actionable website speed optimization recommendations.
It is a part of Google as a whole, towards a faster and more convenient web experience, simply because speed is no longer a comfort option. It directly affects SEO, conversion rates, and user experience.
Unlike basic speed testing tools, PSI provides:
- Performance scores
- Core Web Vitals evaluation
- Real user data (field data)
- Lab-based diagnostics
- Actionable optimization recommendations
PSI combines:
- Chrome User Experience Report (CrUX) → real users
- Lighthouse audits → simulated testing
This dual data model makes PSI one of the most reliable website performance tools for SEO and UX optimization.
Google PageSpeed Insights analyzes your website from two perspectives- desktop performance and mobile performance. And for more accurate results, PSI uses performance analytics and real-world data from both Chrome users. This intricacy makes this tool more reliable for website performance analysis and optimization.
Why Does Page Speed Matter for SEO and Core Web Vitals?
You can have flawless design and high-quality content, but if your website loads slowly, users won’t stay long enough to see it. Nowadays, page speed is no longer optional; it’s a core ranking signal, conversion driver, and user experience requirement.
- A delay of just 1 second in page load time can result in a 7% reduction in conversions.
- Over 60% of global traffic now comes from mobile devices
- Large eCommerce companies like Amazon have consistently reported revenue losses from even small performance delays.
- Users expect pages to load in under 2–3 seconds
This explains the importance of website speed nowadays. Building on this importance, studies consistently show that the majority of website traffic has come from mobile devices from 2017 through 2025, leading to an increase in the expectations of users. They don’t want to wait and want to load a website in less than 2-3 seconds. This has increased the importance of page speed to maintain the UX of websites.
Slow page speed can hurt different aspects, such as:
1. SEO Rankings
Page speed is directly related to SEO rankings, as Google measures the speed and responsiveness of the website as a major ranking factor. Thus, you need to provide the relevant information to the user as quickly as possible.
2. User Engagement
A slow-loading website is annoying for the user and can also provoke them to leave immediately. First impressions are important for the user, as it becomes a perception that a site that loads faster is professional, reliable, and trustworthy. Thus, to fulfill the user expectation, site speed is a vital factor.
3. Conversion Rate
Well, you must have heard that first impressions are the last impression. The same stands for the websites. The user will not return to that site again if they face any issues on the website. Seconds of delay can result in the loss of valuable customers, which will directly affect your conversion rate.
4. Mobile Experience
Mobile users’ expectations for site speed are higher than desktop users. Mobile users are more likely to leave a site if it takes more than 3 seconds. Fast loading time makes the mobile users’ experience smooth and enjoyable, increasing traffic and conversions.
The Business Impact of Google PageSpeed Insights
Even small improvements in Core Web Vitals can result in measurable gains in engagement and conversions, especially on mobile. Google PageSpeed Insights helps businesses identify performance issues that directly affect search rankings, user experience, and revenue. A faster website leads to better visibility, higher engagement, and more conversions.
Key business benefits include:
- Improved SEO rankings: PageSpeed Insights evaluates Core Web Vitals, which are confirmed Google ranking factors.
- Higher conversion rates: Faster load times reduce friction and increase the likelihood of users completing actions.
- Lower bounce rates: Pages that load quickly keep users engaged and reduce early exits.
- Better mobile performance: Optimized speed improves experience for mobile-first users, where most traffic comes from.
- Increased user trust: A fast, smooth website feels more reliable and professional.
- Actionable optimization insights: Clear recommendations help teams fix issues efficiently and prioritize what matters most.
This makes Google PageSpeed Insights a critical tool for driving measurable business growth through performance optimization.
PageSpeed Insights Scores: What Does it Measure?
PageSpeed Insights assigns a performance score from 0 to 100, grouped into Poor (0–49), Needs Improvement (50–89), and Good (90–100). With the Google PSI data, you can easily resolve the pain points and know where your site stands. Understanding score range and meaning just below:
| Score Range | Meaning | What to Do |
|---|---|---|
| 90–100 | Excellent | Maintain & monitor |
| 50–89 | Needs improvement | Optimize CWV & images |
| 0–49 | Poor | Fix LCP, JS, server issues |
You can maintain this score by regularly monitoring your website. A score between 50 and 89 means that your site needs improvements, and there are chances to optimize. And lower scores than 50 denoted the poor performance of a site.
Moreover, PSI displays two separate scores: one is the mobile speed score, and the other is the desktop speed score. This is how you can analyse your website performance on both devices. Mobile speed score is usually lower than that of the desktop, as mobile devices have weak networks and some device limitations.
Important: Do not chase a 100/100 score.
Your real goal should be:
- Passing Core Web Vitals
- Improving real user experience
- Reducing bounce and load frustration
Core Web Vitals in Google PageSpeed Insights
PSI measures the score based on the following Core Web Vitals metrics:
Interaction to Next Paint (INP)
INP measures how quickly a page responds to user interactions like clicks or taps. It reflects real-world responsiveness and plays an important role in improving your Google PageSpeed Insights performance score.
Good INP Score: ≤ 200 ms
Affected by: JavaScript execution, main-thread blocking
First Contentful Paint (FCP)
It is a performance metric that measures the speed and time it takes to load the first piece of content. It plays an important role in improving your Google PageSpeed Insight performance score.
Good score: ≤ 1.8 seconds
Affected by: server response time, render-blocking CSS/JS, font loading, image optimization
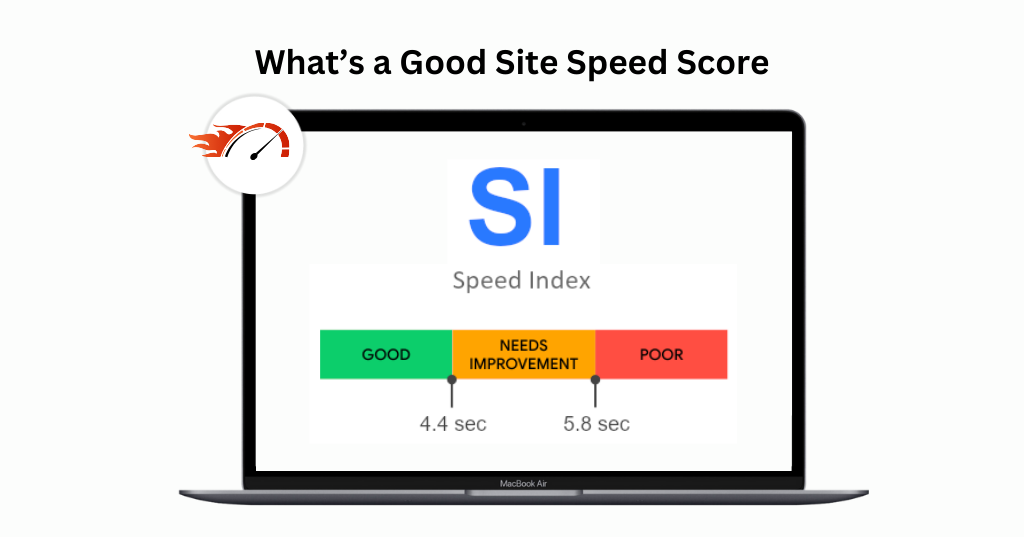
Speed Index
Speed is another primary factor on which website performance is measured. It justifies the responsiveness of the website.
Good score: ≤ 3.4 seconds
Affected by: image size, above-the-fold content, JavaScript execution, critical rendering path
Total Blocking Time (TBT)
It is the duration of the site blocking the main thread while loading the content of the site. The long blocking time impacts the user’s interaction with the site and measures the unresponsiveness of the website.
Good score: ≤ 200 ms
Affected by: heavy JavaScript, third-party scripts, unused code, long tasks (>50 ms)
Largest Contentful Paint (LCP)
It is the key Core Web Vital metric that measures the time it takes for the largest above-the-fold content to load. Above the fold content is what you see first on a website without scrolling.
Good LCP score: ≤ 2.5 seconds
Affected by: images, hero banners, fonts, server speed
Cumulative Layout Shift (CLS)
It measures the unexpected layout shifts that occur in a site while it is loading. It measures the visual stability of a website.
How to Use Google PageSpeed Insights For Your Website?
Google PageSpeed Insights is simple to use, but understanding each step helps you read the report correctly and take the right actions. Follow these steps to use Google PageSpeed Insight and analyze your website performance accurately.
Step 1: First, go to the Google PageSpeed Insights website on the search engine or simply click the URL https://pagespeed.web.dev/.
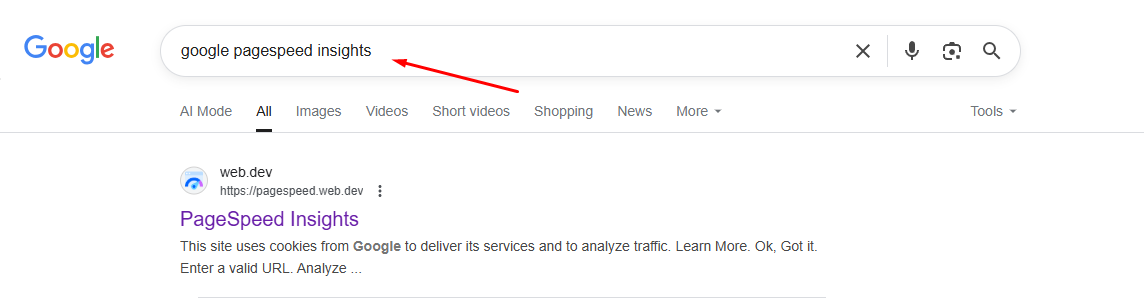
Step 2: Enter your page’s or website’s URL that you want to test in the search bar and hit “Analyze.”
PSI will generate a detailed report, showing:
- Performance score for both mobile and desktop.
- Core Web Vitals metrics analytics.
- Areas of opportunity and strategies for optimization.
- The Lighthouse performance report with actionable recommendations.
Google PageSpeed Insights Report Explained
The PSI report has different sections, which are as follows:
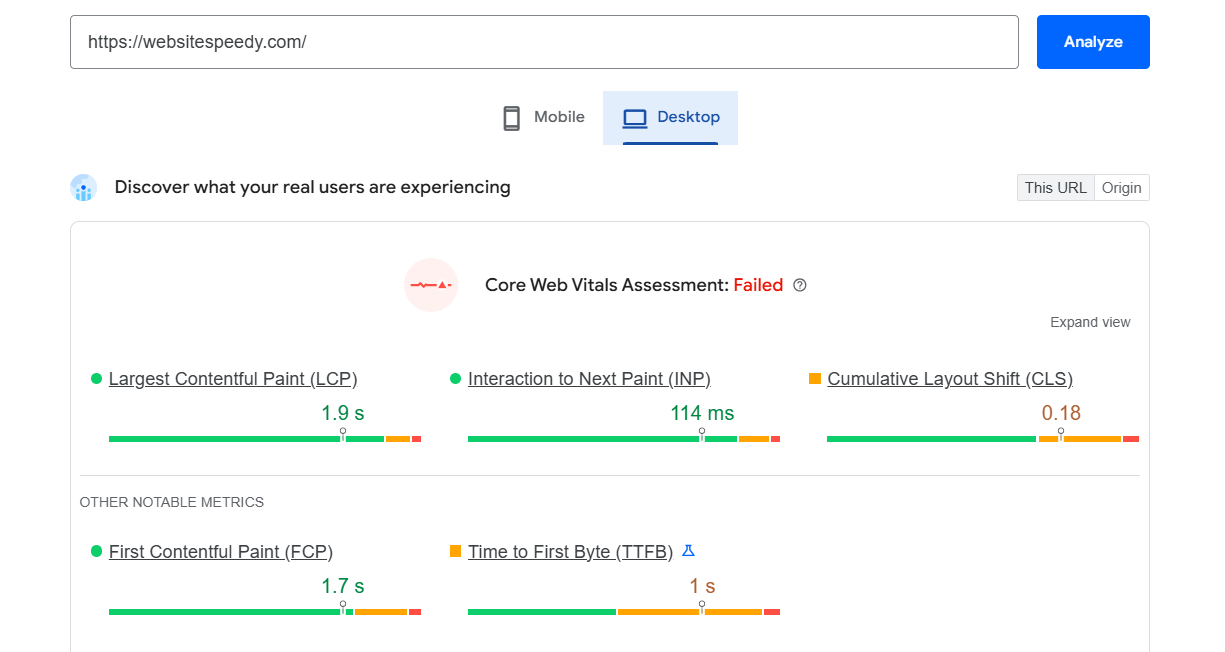
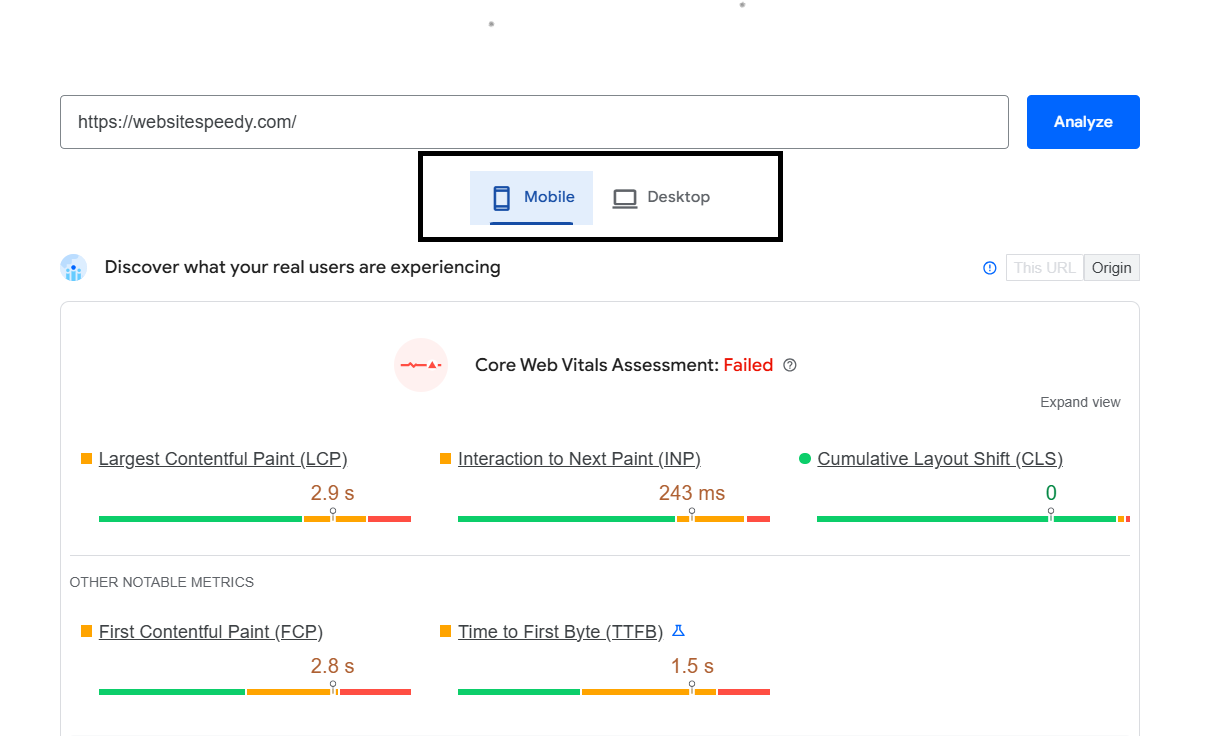
1. Performance Score
This section gives you the overall performance and speed score of your website. The performance on mobile devices and desktops is different due to device limitations. Thus, this report separately shows performance scores for mobile and desktop. You can switch between mobile and desktop scores as shown below:
2. Field Data
This section contains real-world user data that is taken from the Chrome UX report. This measures the actual user experience of your site, which is useful for understanding the real-world performance.
For example, if you open your site on your browser, it may load quickly as your browser has stored the cached version of your site content. While on the user’s browser, the site is opening for the first time, showing the genuine user experience.
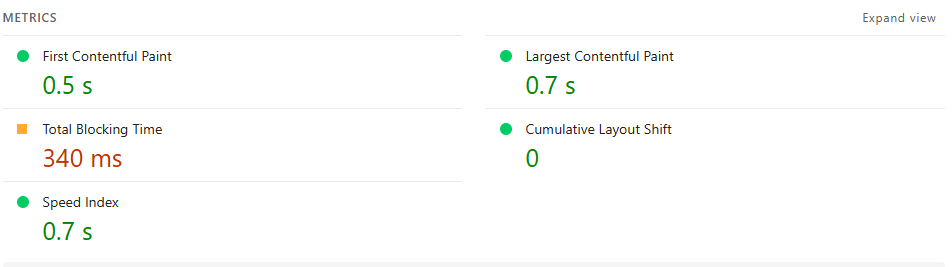
3. Lab Data
This is the simulated analysis from Lighthouse, which includes metrics of:
- Speed Index
- First Contentful Paint
- Time to Interactive
- Total Blocking Time
4. Opportunities
This is the golden section for you, as it provides the suggestions and areas of opportunity in your website. PSI gives suggestions like image optimization for increased speed and eliminating render-blocking resources. Each recommendation comes with the estimated loading time saved in each action.
5. Diagnostics
This section will provide deep insights into scripts, CSS, and other technical areas, which you can fix for deeper optimization. Basically, it’s the diagnostic center of your website, which you can consider when you are done with first aid (basic optimization methods like image optimization).
6. Passed Audits
In this section, you can review the areas in which your website is performing well.
PageSpeed Insights Common Errors and How to Fix Them
One of the best parts of PSI is that it doesn’t just inform you of what is wrong; it gives you how to fix slowness issues with websites. Let’s review a few common calls and fixes.
1. Optimize Images for Speed
- Use next-gen formats like WebP or AVIF for your images as they efficiently compress your images without losing quality.
- Whatever tool you use, such as TinyPNG or Squoosh, when compressing an image, it should be the smallest file possible without loss of quality.
- Serve responsive images, depending on the device. Optimize your web images separately for different devices.
2. Eliminate Render-Blocking Resources
- Combine or defer CSS and JavaScript that are non-critical.
- Use critical CSS inlining for above-the-fold content.
- Use the script attributes correctly, including async and defer.
3. Minimize Server Response Times
- Have a faster hosting provider.
- Use caching (browser caching and server-side caching).
- Consider a Content Delivery Network (CDN).
- Optimize your database and server configuration.
4. Utilize Browser Caching
Cache any and everything, such as images, CSS, and JS files, so that browsers don’t have to download them again.
5. Minify CSS, JavaScript, and HTML
Minimize file sizes by removing unnecessary characters and spaces in your code.
6. Remove Unused JavaScript
Check to see if libraries, frameworks, or plugins are being used and remove all unused files. You should do this regularly for stable optimization.
7. Preload Critical Assets
Ensure that the critical fonts and scripts load faster. For example, focus on your above-the-fold content.
8. Lazy-Load Images and Videos
You don’t have to load images and videos until they’re on screen, as this can increase your initial load speed. Use lazy loading for your images and videos for a smooth user experience.
Is Google PageSpeed Insights Good for SEO?
YES. Page speed and Core Web Vitals are confirmed ranking signals, but they work alongside content relevance, intent, and authority. It is more significant since 2021, as the Core Web Vitals became the official part of the ranking algorithm of Google.
That means poor performance could be holding your site back, even if your content is amazing. I mean, what’s the point of testing users’ patience and making them wait to see your amazing content? So, it’s vital to improve your speed first to provide your intended message to the user.
Common Myths About Google PageSpeed Insights
1. My site must score 100 to rank on Google
False. Speed is a ranking factor, but it’s one of many. Content quality and relevance matter just as much. So, it is good to focus on the betterment of your website rather than chasing the 100 out of 100.
2. Desktop speed score is more important than the mobile speed score
False. Google uses mobile-first indexing to rank websites, so prioritize mobile speed. The mobile user base is drastically increasing, and mobile devices have slower network speeds than desktops, so it’s important to focus on mobile optimization.
3. A single PSI test is enough!
False. Test multiple pages and monitor consistently, as performance can vary by device, network, or location. It is good to test your website after optimization, so you can compare your progress.
Final Thoughts
As speed matters a lot for websites, not only for user experience but also for thriving in Google rankings. No matter how excellent you’ve designed your website and how engaging your content is. If the website speed is slow, then you are out of the search engine page results. Google PageSpeed Insights is your modern solution for diagnosing and even improving your site performance.
You can use PSI for regular website performance analysis and to improve website loading speed. It helps you to fix slow website issues by providing the Core Web report, diagnostic report, and optimization strategies for your website. Follow its recommendations and improve website loading speed to grow your business.
FAQs
Q1. What does the Google PageSpeed Insights tool do?
Google PageSpeed Insights looks at how well your website works on both mobile and desktop. It gives you scores and suggestions for how to speed up loading times, enhance Core Web Vitals, and make the overall user experience better.
Q2. Is PageSpeed Insights beneficial for people who are new to it?
Yes, PageSpeed Insights is easy to use for beginners because it provides you with a straightforward score from 0 to 100 and shows you clear fixes with color-coded suggestions (red, orange, green). Beginners can find places that need to be optimized even if they don't know much about technology.
Q3. Is it free to use PageSpeed Insights?
Yes, there is no cost to use Google PageSpeed Insights. Anyone can type in a website URL and obtain extensive information about how it works and how to make it better right away.
Q4. What metrics does PageSpeed Insights measure?
It measures Core Web Vitals (Largest Contentful Paint, First Input Delay/Interaction to Next Paint, and Cumulative Layout Shift) as well as other metrics, including Total Blocking Time, Speed Index, and First Contentful Paint.
Q5. Why is Google PageSpeed Insights significant for search engine optimization?
In Google Search, the speed of a website and its Core Web Vitals are two of the things that affect its ranking. A higher PageSpeed Insights score makes the user experience better, lowers bounce rates, and can help your search engine rankings.
Q6. How high should a PageSpeed Insights score be to be good?
A score of 90 or higher is great, 50–89 is average and requires work, and anything below 50 means bad performance that could impact SEO and conversions.