


TL;DR: This blog post will help you understand the importance of website speed we have curated by presenting the example of 99+ websites’ statistics in 2025. Here are some effective website speed optimization strategies mentioned and the impact of website speed on conversion rate, bounce rates and user experience.
Website speed is the heartbeat of a great user experience. With increasing expectations for most visitors, a sluggish and clunky website is enough to send them elsewhere. Who likes to wait and stare at the loading bar running in slow motion, even with the lack of patience in users nowadays? A slow-loading website only frustrates the user, presenting an unproductive image of your site.
In 2025, website load time remains a vital ranking factor and a key to a better user experience. As browsing shifts more to mobile from desktop, user expectations rise significantly for a fast load speed. Even a fraction of a delay in loading websites affects the websites’ performance and the success of a business. Website load time is directly related to bounce rates, exit rates, conversion rates, user experience, and ultimately sales. In this article, we’ll dive deeper into this perspective by examining 99+ website load time statistics for 2025.
This article will cover the latest website load time statistics, Core Web Vitals benchmarks, the impact of load time on conversion rate, bounce rates, and effective website speed optimization strategies.
Why Website Speed Matters More Than Ever
Clearing the basics, website loading time is the total time a webpage takes to fully load in the user’s browser. Even seconds of delay in page loading can lead to increased bounce rates and loss of sale. Here are 99+ website load time statistics that will be a significant answer to the question of why website speed matters:
- According to the report by Google Industry Mobile Speed, a 10-second mobile page load time increases the bounce rate by 123% when compared to a one-second loading.
- A study by Google Consumer Insights has found that 53% of mobile site visitors will leave a page if it takes more than 3 seconds to load.
- 47% of users expect a website to load in less than 2 seconds.
- And almost 70% of consumers have agreed that page speed impacts their likelihood to buy from an e-commerce website, according to the page speed report.
All these statistics about website load time state that a slow website frustrates customers and also affects the business’s profits. So, in this evolving digital era, it is crucial to optimize your website speed for a better user experience and business growth.
99+ Website Load Time Statistics 2025
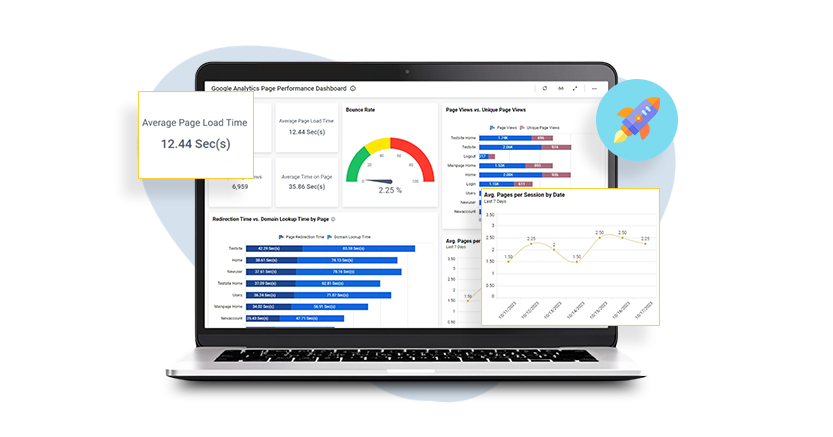
We present the top website loading metrics for 2025, including average page load time, median page load time, Largest Contentful Paint (LCP), server response time, and First Contentful Paint (FCP). These statistics are based on data from leading United States websites in 2025, offering insights into the latest performance benchmarks and user experience expectations.
Here are some research analytics on top website load time statistics, based on users’ activities, website load times, and performance. These studies will help you understand more about the importance of loading time and how important it is to consider that.
1. A single second of extra load time reduces customer satisfaction by 16%.
Research shows that every single second a web page takes longer to load reduces page views by 11% and damages users’ sense of satisfaction. While the immediate impact shows up as lost sales, the longer-term effect of persistent latency is damage to brand loyalty. A user who encounters slow performance grows less inclined to make a return visit, to recommend the brand, or to extend future trust; the cumulative result is a compression of the lifetime value that each acquired customer is capable of delivering.
2. Reducing load time by just 1 second can reduce conversions by 7%.
In the digital world, even seconds of delay matter. Akamai research shows that a 1 second delay correlates with a 7% decline in conversion rates. For a representative e-commerce business posting daily sales of $100,000, that fractional delay translates to $7,000 of lost revenue each 24-hour cycle. This data shows that even a few seconds of reduced speed can impact your sales a lot. So, don’t miss a single chance of improvement.
3. When the load time exceeds four seconds, a quarter of visitors to any given website will abandon the session.
Analysis of traffic behavior shows that the four-second delay operates as a tipping point for websites that enjoy continuous visitor flow, the resulting drop-off compounds to a potentially multimillion-dollar monthly opportunity cost. Culprits typically include oversized media files, lagging server-side processing, or code that, with targeted refinement, could be substantially accelerated.
4. Agrofy cut exit rates by 76% with faster image loads.
Agrofy recorded a reduction in bounce rates from 3.8 percent to 0.9 percent following optimizing slow-loading web images, which in turn minimized abandonment rates significantly by 76 percent.
5. Loading speed is directly related to revenue; even fractions of a second matter.
E-commerce environments hover close to a tipping point in user tolerance. When a product page hits a 1-second rendering time, the site enjoys an average 3.05% conversion ratio. At 2 seconds, that ratio falls to 1.68%. Suppose an item retails for $50; the site would then earn $1,525 from 1,000 visitors at 1-second speed. Stretch that load to 2 seconds, and the revenue collapses to $840. The 1-second drift alone subtracts $685 from the top line.
6. Lead generation pages convert better with faster load times
The impact on lead capture is equally stark. For lead-gen properties, conversion rates ascend incrementally for each fragment of time borrowed from the load cycle. A page that finishes within 1 second turns 39% of new visitors into form fillers; at 2 seconds the yield is 34%, and at 3 seconds it dips to 29%. Since lead generation depends on the user reaching and completing a multi-field form, even a small improvement in speed equates to a tangible reduction in abandonment before the user enters contact information.
7. Each second removed from a page’s load cycle correlates to an average 17% rise in conversion events.
Empirical testing shows that each reduced second in load times increases conversion rates by 17%. The arithmetic is brutal and clear. The impact on conversion rates hurts a business’s growth and profitability. Increased conversion rates are important to provide a seamless interaction to the user and to build trust.
8. Vodafone increased sales by 31% by improving LCP
Vodafone recorded an 8 percent rise in sales after trimming its Largest Contentful Paint (LCP) by 31 percent. Complementary gains included a 15 percent lift in the lead-to-visit ratio and an 11 percent gain in the cart-to-visit metric. These results demonstrate that targeting Core Web Vitals delivers more than performance; it translates into quantifiable revenue growth grounded in superior user experience.
These statistics, based on user experience, shows that loading time is a major factor to maintain a stable user experience. Also, load times are directly correlated with the sales and conversion rates. Thus, for the growth of your business, the benchmarks set by search engines are vital to follow. But what are these benchmarks? Let’s understand them accurately through numerical data.
Benchmarks for mobile, desktop, and tablet loading speed
Based on the statistics, website load speed is very important for businesses. So, the key question becomes: what benchmarks should websites focus on to stay ahead in speed performance? Here are the major benchmarks used to measure load speed:
1. First Contentful Paint (FCP)
It is the time that a website’s components, including content, images, video, etc, take to appear on the user’s viewport when they open a website. Thus, it calculates the rendering time of the site’s elements when it opens for the first time. A good benchmark for FCP for mobile is ≤ 1.8 seconds and for Desktop is ≤ 1.5 seconds. It puts the first impression on the user, helps building trust and ensures the revisit of the user.
2. Cumulative Layout Shift (CLS)
It measures the visual stability of a website while page loading and calculates the amount of unexpected shifts a page takes. For example – if you click on a button and it gets shifted by clicking that’s a layout shift. CLS can create a bad user experience if it results in higher numbers on a website. High CLS rates can cause accidental clicks, leading user frustration and hurting the reliability and trust of the website. It’s a vital UX signal for Google’s Core Web Vitals. Less than 0.1 seconds of CLS is considered as the good benchmark of CLS score.
3. First Input Delay time (FID)
We all know that establishing a good first impression is crucial. FID means the time that a browser takes to respond after the user’s first interaction to the site. It’s the first impression on clicking, tapping, or pressing a key and the response of the browser on the same. A good FID builds trust in the user to visit the site again.If it takes a long time to respond after a user clicks a button, the waiting time can frustrate the user and the site will feel broken to the user, hurting the UX of the site. A good benchmark for FID is less than or equal to 100 ms.
4. Speed Index (SI)
As we have discussed above, site speed is an important metric that measures the time that a main page content takes to load. SI measures how quickly a web page is displayed. It is calculated by a video capture of the page load process. It is important as it reflects the main speed of the site’s content loading at first when a user visits a website. Slow loading times can increase bounce and exit rates of the user. For mobile, a good benchmark for speed is less than 3.4 seconds and for desktop it is less than 2.5 seconds.
5. Largest Contentful Paint (LCP)
LCP is the largest visible element of a site’s page. It calculates the time that a hero image or main heading takes to fully render on the user’s screen. It is one of the most important Core Web Vital metrics. A slow loading of LCP puts a bad impression on users that the main content of the site will also load slow. Boosting the render speed of LCP is important to maintain a good impression on users so the user gets motivated to scroll further. Less than 2.5 Seconds of LCP is considered to be a good benchmark.
6. Time to Interactive (TTI)
TTI is the time that elements and scripts of a website take to get fully loaded, meaning the user can click or scroll on any image or component without a delay. Measures how much time a page takes to become fully interactive. If a user clicks on anything and the site takes time to respond, even if the site looks ready, the user will get frustrated. TTI ensures that the site is completely usable and not just look ready. A good benchmark for TTI is ≤ 3.8 seconds on mobile and ≤ 2.5 seconds on desktop.
The Impact of Load Time on SEO
Improving Core Web Vitals is a way to lead in search engine rankings, but CWB alone can’t help you. These are just one of the factors that can help you enhance your user experience.
But the fact is that SEO rankings have a significant relation with LCP.
The average LCP that leads to a website in the first position in Google search results on desktop is 2.13 seconds. For 10th position, it’s 2.18 seconds and 2.2 seconds for 20th position. These all fell into the “good” LCP benchmark of 2.5 seconds. You can keep a regular track of your positions by using rank tracking tools like Semrush and Google Search Consoles.
What are Core Web Vitals
Core Web Vitals are metrics that were introduced in 2020 by Google. These metrics measure the UX of web pages in quantitative terms. It categorizes the website’s UX as good, improvement needed, and poor performance categories.
The metrics used as Core Web Vitals are:
- Largest Contentful Paint (LCP)
- Cumulative Layout Shift (CLS)
- First Input Delay (FID)
- Interactive Next Paint (INP)
These are the metrics on the basis of which a website’s UX is measured. You are familiar with these metrics already, as we have discussed them before in this article. LCP, FID, and now INP all relate directly to page speed. The ‘good’ threshold for LCP, 2.5 seconds, is now widely used as the standard for a good page load time.
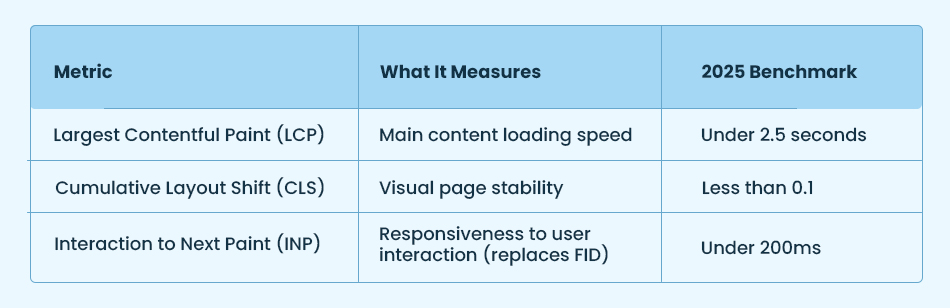
Core Web Vitals Benchmarks 2025
How to Improve Website Speed for 2025
Improving website load time means improved site speed, better SEO, higher conversion rates, lower bounce rates, and a higher chance to thrive in search engine rankings.
These are some effective strategies for improving your website performance:
1. Mobile-First Design
In this smartphone era, most of the traffic comes from mobile phones nowadays, so it’s mandatory to create a mobile-responsive website for higher traffic. Test your website’s responsiveness on mobile devices rather than being fully relied on mobile responsiveness checking tools. Check your website for a better web experience and design your website for mobile-first then scale up further.
2. Optimize Core Web Vitals
Google’s Core Web Vitals are an important metric on which search engines are considering websites for rankings. Surprisingly, higher authority websites like apple.com are lacking in CWV metrics. Aim for a good LCP score; less than 2.5 seconds. CLS, less than 0.1 seconds and INP, less than 200ms. Google’s PageSpeed Insights and Lighthouse are the tools to audit and monitor your website’s Core Web Vitals.
3. Compress Images
Use responsive and light images, as 50% of your website loads slowly due to images. Compress your web images in modern formats like WebP, and AVIF, which reduce file size without losing quality. Also, choose a suitable image format for your web images, for example, JPEG for photographs, PNG for transparent images, and GIFs for simple animations and icons and so on.
4. Lazy Loading Media
Use the delayed loading or lazy loading technique, as this will reduce the initial load time of a site. Images will load only when they are about to appear in the user’s viewport, and create the feeling of a fully loaded website to the user. This technique for image loading delays the loading of other images of the website and loads the site images preferably as the user scrolls and interacts through the page.
5. Enable Caching
Use both server-side and browser-side caching features to reduce the load of a server and enhance user experience when they revisit. It will create trust in the user and a good user experience of revisiting the site. Also, enable Content Delivery Networks (CDNs) so that the server can serve cached copies to the users.
6. Minimize HTTP Requests
Fewer site actions mean fewer HTTP requests. You can minimize HTTP requests by combining CSS and JS files, optimizing and reducing plugins and third-party scripts, so that your server has to make fewer HTTP requests. Also, optimizing your site for images and videos is necessary. Eliminate the images and videos that are not adding value to your site and only increasing HTTP requests and space on the site.
7. Technical SEO
Make sure you’ve fixed everything technically, like cleaning of unnecessary plugins, and files, reducing redirect chains, fixing broken links, and unused CSS and JavaScript files. These all are helpful in increasing site speed and boosting SEO of your website.
8. Monitor and Audit your Site Regularly
Regular testing and monitoring are necessary to keep real-time user data. With the time, sites can create links and extra redirects which need to be optimized timely. Tools like Hotjar and GA4 present analytics about your website to help you figure out problems and optimize them, particularly.
Conclusion
After going through the website load time statistics for 2025, we can examine that top performers are thriving in search engine rankings and those who are lagging in maintaining metrics and Core Web Vitals are failing to meet users’ expectations. We have listed some website speed optimization strategies that not only lower bounce rates on websites but also improve conversion rates, helping you secure a better place in search results rankings.
Frequently Asked Questions
1. What are the latest website load time statistics for 2025 across devices?
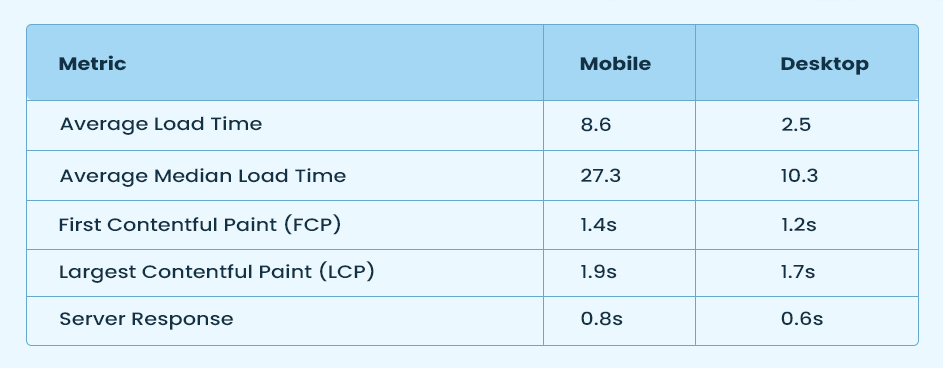
Desktop: For the world's top 100 websites, the average load time is 2.5 seconds for desktop. For LCP, the average loading time is between 1.7 and 1.9s. Mobile: It is slower, with an average load time of 8.6 seconds. Mobile pages take a longer time to load in comparison to desktop. For LCP, the average load time is between 1.8 and 1.9s. Thus, server response time is slower by 0.8 seconds on mobile devices. Tablet: Studies reveal that for tablets, LCP is between 2.1–2.3s, approximately, making them the slowest of all three devices.
2. How do Core Web Vitals 2025 benchmarks influence SEO rankings now?
Google's Core Web Vitals are directly related to ranking factors that remain vital in 2025, too. Core Web Vitals, load speed are some of the factors according to which search engines rank websites. Meeting good scores, mobile responsiveness falls under the CWV benchmarks impacting SEO rankings.
3. What strategies are most effective in reducing bounce rate with faster websites in 2025?
The fastest and efficient strategies are optimizing web images, minimizing scripts, enabling caching, Content Distribution Network (CDN), Minifying CSS and JS files, implementing lazy loading, and prioritizing mobile user experience. These strategies are crucial to enhancing user experience and rankings.
4. How does the impact of load time on conversion rate vary between desktop and mobile sites?
Mobile: Conversion rates and user tolerance rates are both crucial to mobile devices. Every second of delay drops the conversion rate by 20%. And even a 0.1 second of improvement in mobile speed can add up to an 8.4% increase in conversion rates. Desktop: A slightly higher tolerance rate is seen in desktop users, as 1s of delay causes a 4-5.6% drop in conversion rates, which is lower in comparison to mobile devices.
5. What are the top website speed optimization strategies to improve user experience in 2025?
- Optimizing server response times to reduce backend delays
- Implications of CDN to reduce latency for international users
- Reducing HTTP requests to minimize site load
- Compress images in modern formats like AVIF and WebP
- Enable caching to reduce HTTP requests
- Implementing Lazy load for images and videos, below-the-fold
- Focusing on Core Web Vitals
These are some efficient and commonly used methods for website speed optimization to improve user experience in 2025.