


Introduction
Nowadays where speed is of the essence, a website’s page speed can be a make-or-break factor in user satisfaction. We’ve all experienced it – the frustration of waiting for a webpage to load, only to find it lightning-fast one day and painfully sluggish the next. But why does this happen? What causes website page speed to fluctuate, and is there anything you can do about it? Let’s dive into this digital mystery and uncover the reasons behind these speed variations.
Why Your Score Fluctuates?
One of the primary culprits behind fluctuating page speed is the volume of traffic your website receives. Think of your website as a bustling highway. During off-peak hours, it’s smooth sailing, and your site loads quickly. However, when rush hour hits – a surge in visitors – the highway becomes congested, and your site’s response time slows down.
Heavy traffic can overwhelm your server’s capacity to handle requests, resulting in slower load times. A study by Akamai Technologies found that a 100-millisecond delay in website load time can lead to a 7% decrease in conversion rates.
Another significant factor is the quality of your hosting provider. Shared hosting, where multiple websites share server resources, can lead to unpredictable performance. When neighboring sites experience traffic spikes, your site may suffer. Upgrading to a dedicated or Virtual Private Server (VPS) hosting can provide more reliable and consistent speeds by allocating dedicated resources to your site.
The factors contributing to changes in Performance Scores, emphasize that each metric within the score is influenced by multiple variables affecting their start and stop times/duration. The interconnected nature of these metrics can lead to fluctuations in the overall Performance Score.
The discussion identifies specific factors that contribute to changes in Performance Scores:
- Network Speed and Latency: Delays in data transfer between the server and the client, influenced by connection speed, network protocol, packet loss, and server location.
- Caching: Various types of caching, including browser caching, server-side caching, and CDN caching, can impact web performance. The status of the cache may lead to fluctuations in the Performance Score.
- CDN Performance: Content Delivery Network (CDN) performance, dependent on the CDN provider, may result in inefficient resource delivery or inconsistent performance. Routing plays a crucial role in determining which Edge Server the CDN sends users to for retrieving static resources.
- Server/Hosting Performance: Poor hosting performance or insufficient server resources can increase page load times and degrade web performance. Overloaded servers may lack the necessary resources to generate pages efficiently.
- Third-Party Performance: Third-party resources, not served from the host server, may cause delays due to slow server response times, DNS lookups, redirects, and other issues.
- Other Reasons: A combination of the aforementioned factors, along with potential performance variance on GTmetrix servers, can contribute to changes in the Performance Score. While efforts are made to maintain a consistent performance benchmark, transparency is maintained regarding the possibility of occasional variations.
Users with a comprehensive understanding of the intricate web of factors influencing Performance Scores reinforce the message that website performance is subject to many interdependencies.
How Much Fluctuation is Acceptable?
Establishing expectations regarding Performance Score fluctuations. It emphasizes that, in general, a Performance Score should not undergo drastic changes between tests. A significant dip in Performance Metrics may indicate a substantial performance-related issue that needs attention. For instance, a third-party service taking too long to load could be a potential red flag.
Anomalies, as indicated by dips in the history graph, warrant investigation. On the other hand, if the Performance Score experiences only mild changes between tests, users are reassured that this is a normal aspect of internet dynamics, and small fluctuations are to be anticipated.
The concept of spiky but stable graphs, which are considered normal and reflective of varying network and internet conditions. Establishing a performance benchmark over time is deemed important. A consistently worse Performance Score or a significant spike, compared to the established benchmark, is highlighted as abnormal and necessitates investigation.
How the Performance Score is Weighted?
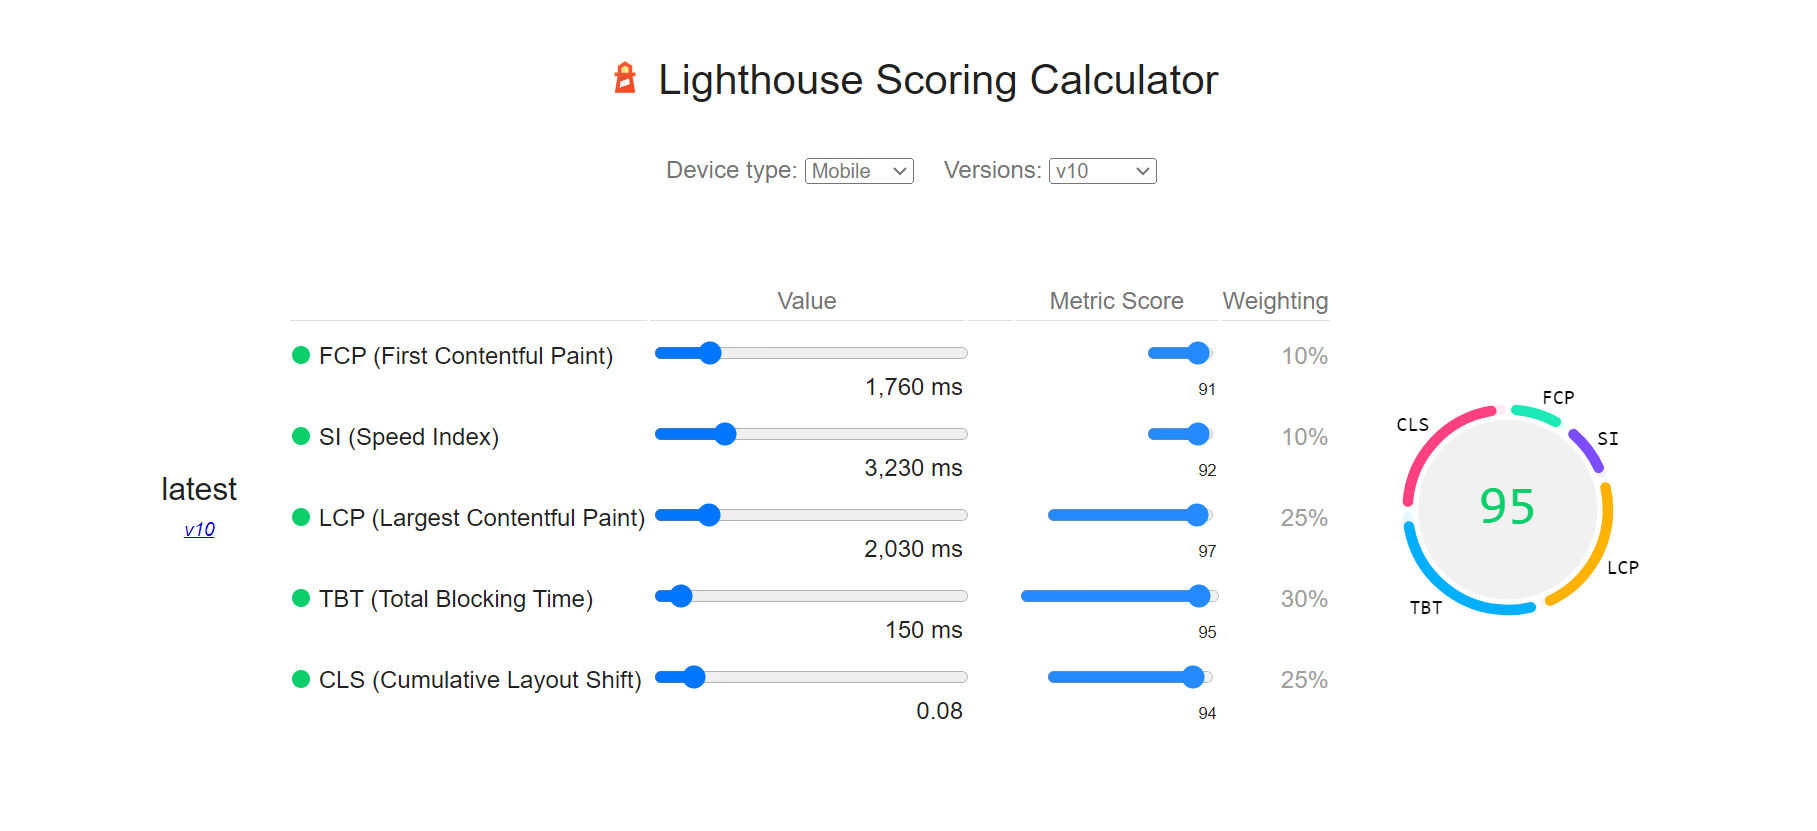
Understanding how performance scores are calculated is essential. Google’s PageSpeed Insights tool, for example, assesses websites based on various metrics and assigns a score. These metrics include
- Total Blocking Time (TBT) – 30%
- First Contentful Paint (FCP) – 10%
- Speed Index (SI) – 10%
- Largest Contentful Paint (LCP) – 25%
- Cumulative Layout Shift (CLS) – 25%
The importance of these metrics varies, with some carrying more weight than others. For instance, Google’s John Mueller notes that while CLS is crucial for user experience, it doesn’t have a direct impact on rankings.
How Metric Scores Are Determined?
FCP measures the time it takes for the first piece of content to appear on the screen, while LCP assesses the loading speed of the largest content element. CLS quantifies the visual stability of a page during loading. Each metric contributes to the overall performance score, which ranges from 0 to 100. A higher score indicates better performance. However, achieving a perfect score can be challenging, and a score of 90 or above is generally considered excellent.
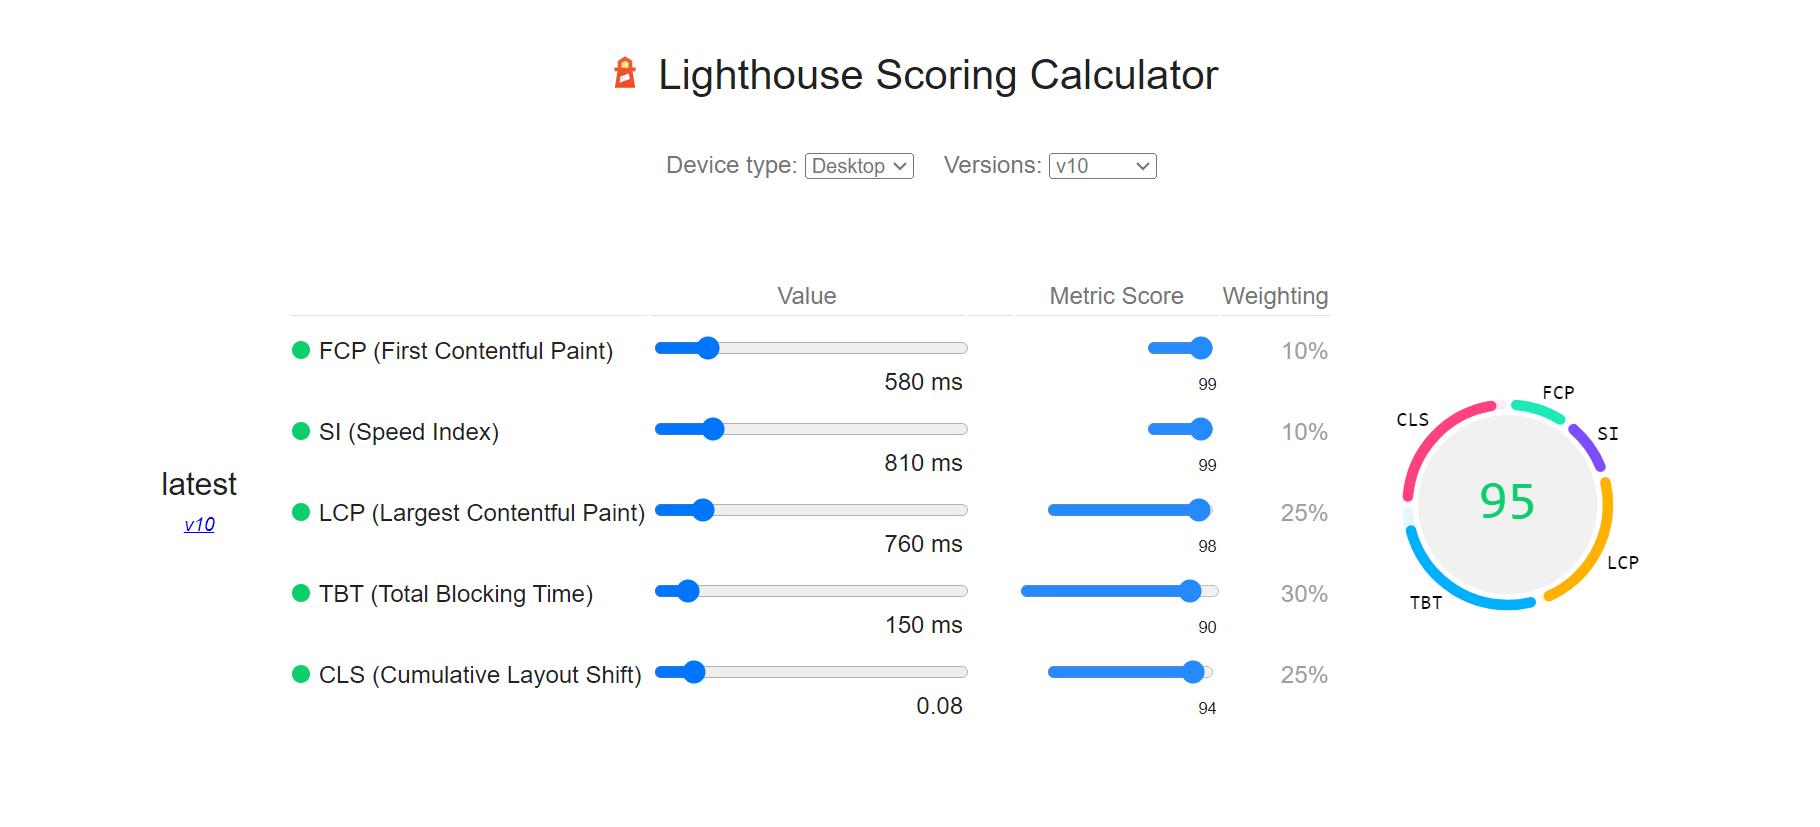
How Desktop vs. Mobile is Handled?
It’s essential to address the differences in scoring for desktop and mobile devices. Google recognizes the significance of mobile optimization, as mobile traffic continues to rise. Page speed on mobile devices can be influenced by factors like network conditions and device capabilities. Therefore, Google assesses websites separately for desktop and mobile, and it’s crucial to prioritize mobile optimization to provide a seamless experience for mobile users.
The Challenge with Page Speed Insights
While tools like Page Speed Insights are valuable for assessing website performance, they do have limitations. For instance, they provide a snapshot of performance at a particular moment, which can vary due to various factors. Additionally, these tools rely on lab data, which may not always reflect real-world user experiences. Real user monitoring (RUM) solutions, which collect data from actual users, can provide a more accurate picture of performance.
Other Factors Affecting Google Lighthouse Performance Score
Apart from the factors mentioned above, several other elements can influence Google Lighthouse performance scores in multiple audit runs. Third-party scripts, such as those for ads or analytics, can introduce variability. Network conditions, including fluctuations in latency and bandwidth, can impact speed. Server response times, which can be influenced by hosting quality, also play a role.
How to Deal With Lighthouse Performance Score Variance?
So, how can you deal with the variance in Lighthouse performance scores? Here are some practical steps:
- Regular Monitoring: Keep a close eye on your website’s performance using tools like Page Speed Insights and real user monitoring solutions.
- Optimization: Continuously optimize your website, including image compression, code minification, and server configuration.
- Hosting Upgrade: Consider upgrading your hosting plan to handle increased traffic and ensure consistent performance.
- Content Delivery Networks (CDNs): Utilize CDNs to distribute content and reduce the load on your server.
- Mobile Optimization: Prioritize mobile optimization to cater to the growing number of mobile users.
- Real User Monitoring: Implement RUM solutions to gather data on real-world user experiences.
- Regular Maintenance: Perform regular maintenance, updates, and performance audits to identify and address issues.
Conclusion
In conclusion, website page speed fluctuations are a common challenge in the digital landscape. Understanding the factors contributing to these fluctuations and implementing proactive measures to optimize performance can lead to a smoother user experience and better business outcomes. By staying vigilant and addressing speed issues promptly, you can ensure that your website consistently delivers a fast and reliable experience to your visitors.
Do you have any questions regarding website page speed fluctuations or performance optimization? Feel free to share your thoughts or contact us.