TL;DR: UX or user experience is measured through various metrics including load speed, layout understanding, content readability, responsiveness across devices and even on appearance and structural design of a website.
The retired Vice President of User Experience Research and author of Measuring User Experience, Tom Tullis, defines user experience (UX) as encompassing all the aspects of user interactions with a product, its application, and other related systems.
User experience (UX) is not just about how your site looks; it is all about how well your site performs. Know how to measure user experience UX metrics mean how easily users can use your site, and whether it fulfills the users’ expectations or not.
An unattractive and slow site impacts everything from web performance to user satisfaction score, and bounce rates to conversion rate.
In this blog post, you will learn how to measure user experience UX metrics and effective tools to measure it. At the end of this article, you’ll be able to improve user experience by optimizing your site according to the user satisfaction score by measuring your site’s UX.
Understanding User Experience

Before we proceed towards measuring user experience UX metrics, let’s learn about UX, user experience, completely from scratch to end.
Hearing the word ‘user experience’, some of you will think that it’s about the visual appearance of your website or how your site looks. But reality is completely far from it as UX is not just limited to aesthetics and design; it includes technical performance, content, and intent clarity. Basically, it covers the whole experience and feel of a user from their first click to final conversion. Thus, measuring UX comprises various aspects mentioned here:
Technical Performance
How your site worked in its technical aspects, like load speed, page speed, and how stable and responsive your website is for the user.
Content Readability and Clarity
It measures how easy it is to grasp and read your site content and how easily users have built trust and act on your offers.
Appearance and Structural Design
To what extent does your site seem intuitive, accessible and attractive with its layouts, colors, design and navigation.
User Satisfaction and Outcomes
It’s about the user satisfaction score, which measures how successfully your business goals can impact the user.
By unfolding these layers of the user experience UX it is now worth heading towards – how to measure user experience UX metrics and what is its actual significance in improving user experience.
User Experience in Web Development

To improve user experience in web development, you need to make your site technically seamless and responsive, where users can navigate, interact and perform the intended action.
Google’s Core Web Vitals—Largest Contentful Paint (LCP), Interaction to Next Paint (INP), and Cumulative Layout Shift (CLS)—highlight the importance of speed, stability, and responsiveness.
Here are the factors that impact the UX and web development performance of your website:
Page Load Speed
The first major factor to note here is page speed, which marks the first impression on the user. A fast page loading speed increases the traffic on your page and reduces bounce rates.
Visual Stability
It’s a very common glitch that your site creates a sudden layout shift, mostly at the time of checkout or sign-up, which can frustrate users and harm user experience.
Interactivity and Input Delay
It is important to improve the interactivity of the user so that the user can interact quickly with actions like forms and buttons on your site. Your site should be able to make the user navigate seamlessly, without any disruption.
Responsiveness Across Devices
Optimizing your web performance across every device is important, such as mobile optimization, as major traffic is coming from smartphones nowadays.
Security and Trust Signals
Secure and safe browsing is also a sign of a good user experience. You should maintain HTTPS encryption, secure checkout processes and error-free interaction for a positive and improved user experience.
A website with aesthetic and meaningful designs can also lack in grabbing a good user satisfaction score if it has poorly managed or optimized code, unstable elements, and glitchy interactions. Also, a sluggish site can significantly harm user engagement and SEO rankings as well.
User Experience in Web Design

A visually messy and confusing layout and interface can confuse the user, resulting in increased bounce rates, early exit, and incomplete tasks. Poor visuals on a site can disrupt the user’s interaction and navigation, making it hard for the user to focus.
Whereas, an optimized website with clean designs helps users interact and navigate smoothly, engaging the user for a longer time. At this point, it’s essential to know how to measure user experience UX metrics according to the design perspective. You should choose design and elements that enhance how users interact and navigate your website. Keep these factors in mind with the design perspective:
Content Readability
How easy and comfortable is your content to consume, is measured by the time spent and scrolling time of the user.
Navigation Clarity
The ease of task completion, bounce rates and path analysis rates show how easily users have found what they needed.
Responsive Adaptation
Responsiveness of your design in every device type can be seen with the device-specific engagement metrics.
Intuitive & Emotional Interactivity
You should measure if your choices of design and colors can interact with the desired feelings or not; you can check it through sentiment analysis and reviews.
User Experience in Business
User experience is not just about page visits or views, but it is directly connected to business performance. The success rate of your business also depends on measuring user experience UX metrics. Here are the points essential to measure UX from a business point of view.
Conversion Rate
The ultimate motive of the website is the conversion rate. It is a clear sign of your UX success.
The Points of Abandonment
This can help you analyse the low points and problem areas in your website where the user makes an exit. Analyze where your customer experience or content flow breaks.
Customer Retention Rates
A satisfactory UX encourages repeat visits, which is more better than one time conversions, indicating trust and loyalty from the user.
Net Promoter Score (NPS)
It’s a survey-based metric that helps you measure how satisfied your users are and how likely they are inclined to recommend your brand to others.
Help Requests & Complaints
An increased number of help requests indicates poor navigation, UX friction, and a lack of functionality of your website.
How to Measure User Experience UX Metrics – The Factors You Should Track

To optimize your website engagement, it’s vital to know how to measure user experience UX metrics. These are some UX indicators that will help you measure your website performance and provide meaningful insights for the same:
1. Google’s Core Web Vitals (LCP, INP, CLS)
Largest Contentful Paint (LCP)
These metrics directly connect to the load speed time, which is how quickly the user sees the most significant content of your site in the viewport.
An optimal LCP should be under 2.5 seconds, which is supposed to be ideal. A slow LCP indicates a sluggish site and slow loading, especially on mobile devices.
You can track LCP with tools like PageSpeed Insights and Website Speedy. And improve it by techniques like image optimization, lazy loading, etc.
Interaction to Next Paint (INP)
It is the replacement of First Input Delay (FID) and measures how fast your site responds to users’ actions, such as clicks and taps. It evaluates when the page renders after the user initiates an action. A good INP is under 200 milliseconds. It means that the action should commence without delays before this time limit; if not, then frustration can build.
You can improve it by optimizing heavy JavaScript, reducing third-party tools, and managing script loading times.
Cumulative Layout Shift (CLS)
CLS evaluates how much shifts a web page is taking, like jumping buttons, moving texts and page shifting during ad loading. A CLS below 0.1 indicates a visually stable experience. And the reason for high CLS is unspecified image dimensions or unsuitable web fonts.
To reduce CLS, set the attributes for images and embeds and avoid inserting components or fonts on already loaded content. And it’s about layout stability, so check for it with tools like Web Vitals Chrome extension.
2. Page Load Time
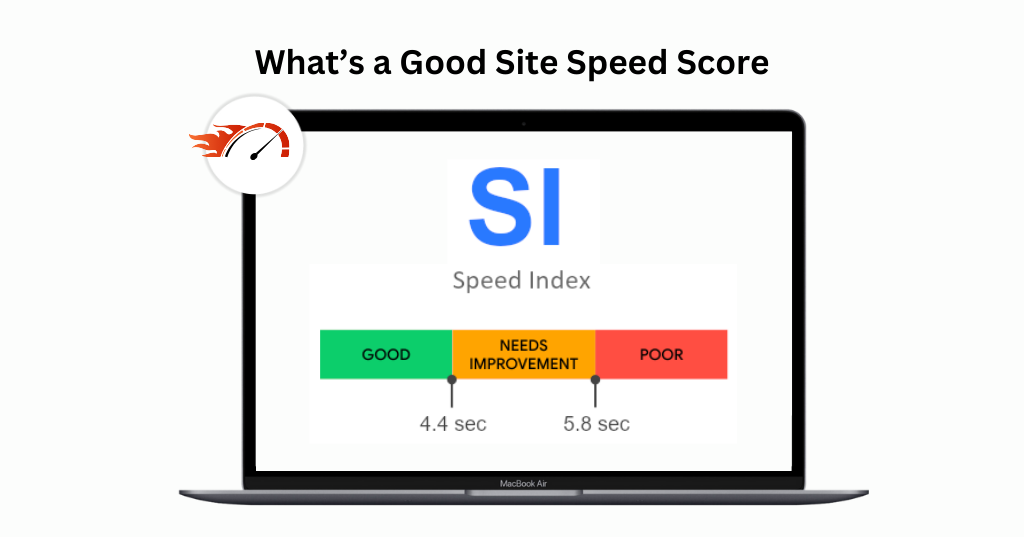
Page load time measures how much time a webpage takes to be fully loaded. However, user expectation is of less than 3 seconds to load a page, as the bounce rate and exit rate will increase. LCP evaluates specific elements; on the contrary, this metric evaluates the total load times. Slow load time is commonly due to unoptimized, heavy images, heavy scripts, and maybe server issues.
Use tools like Google PageSpeed Insights, GTmetrix, or Website Speedy to monitor this metric. You can improve user experience and loading speed by optimizing files and images, applying lazy loading and minimizing third-party scripts.
3. Bounce Rate
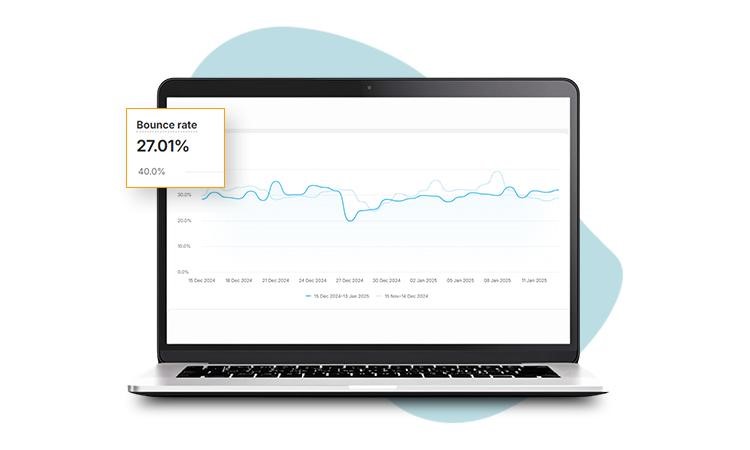
Bounce rate means how many users have left a page without establishing further interaction. It shows the percentage of single-page sessions abandoned by users without further interactions.
However, a high bounce rate indicates poor UX, context, or intent matters. A page that is solving a single purpose naturally has higher bounce rates. Confusing layouts, slow loading, or unclear CTAs often lead to more user exits.
4. Session Duration
Session duration means how long a user stayed or interacted with your pages. In simple words, it means the length of a user on your page. Longer sessions means stronger engagement and show interest of the user, boosting the user satisfaction score.
Tools like Google Analytics can help you track detailed session data.
You can enhance content flow, add attractive components, including videos or quizzes to increase session duration on your site.
5. Scroll Depth
As the word says, it means the scroll depth of the user. Meaning, for how far a user has scrolled down a page. If the scroll session is till halfway through your page, then it indicates that your content or design isn’t resonating with them. Low scroll depth signals weak introductions or starting, poor visual hierarchy, lack of information, or maybe overload of content.
Tools like Google Tag Manager and Hotjar allow you to set scroll triggers. However, to improve engagement and increase scroll depth, you can break content into small sections so that users can consume it easily, add visual attractives, and place key offers or messages in attractive phrases at the top of your page.
6. Click-Through Rate (CTR)
It is the click rate of the user. It measures how often users are clicking buttons or links on your site compared with the viewed impressions. Low CTR means unclear messages or values that may be difficult to understand. Weak placement of the links and values, and poor design can also be the reason for low CTR.
To track the CTR of your pages, use tools like Google Analytics event tracking, heat mapping tools like Hotjar and Mouseflow, or dedicated A/B testing platforms like Optimizely.
You can improve CTRs by making links visually clear and distinct.
7. Conversion Rate (CR)
Conversion rate means if the user completes a desired action like signing up, purchasing, downloading or booking a demo. It directly increases your conversion rate, reflecting encouragement of the user toward your business goal.
Low rates can be due to friction or glitches in the forms, poor mobile optimization or unclear messages.
You can use tools like Google Analytics 4, Semrush, Mixpanel, or Matomo to monitor CR performance.
Improve CR by simplifying the steps, and making your navigation simple and streamlined across devices.
8. Funnel Drop-off
Funnel drop off helps you analyze from which point the user is exactly returning or leaving the site. It is measured by analyzing the user’s sequence of operations. This helps you diagnose or correct where the issue is arriving.
Reduce drop-off by minimizing required fields, offering autofill options, clarifying progress indicators, and testing variations through A/B experiments.
9. User Feedback and Surveys
Unlike every qualitative analysis, this is a qualitative analysis that suggests the reasons and reviews of the user where the site is lacking. Qualitative data provides real user perspectives, revealing the “why” behind user behavior.
Suggested tools for checking this are Google Forms, Hotjar, Qualaroo, SurveyMonkey, post-interaction emails, or usability testing platforms like UserTesting to collect this data. You can also analyze and search for patterns in complaints, requests, or confusion points.
Asking simple questions like “What stopped you from completing your task today?” often uncovers hidden friction you won’t catch with analytics alone.
Conclusion
Finally, you’ve learned about the metrics and tools to measure user experience UX metrics. Solution comes from the problem, so it’s necessary to find the problem first! Likewise, these tools and their metrics will help you finding the points where your site is lacking so you can fix the errors and improve user experience on your site. Use this knowledge and increase the user satisfaction score of your site.


